-
Bug
-
Resolution: Done
-
 Major
Major
-
RHODS_1.6.0_GA
-
5
-
False
-
False
-
None
-
Yes
-
-
-
-
-
-
1.11.0-3
-
No
-
No
-
Yes
-
None
-
RHODS 1.11, RHODS 1.12
-
Important
Description of problem:
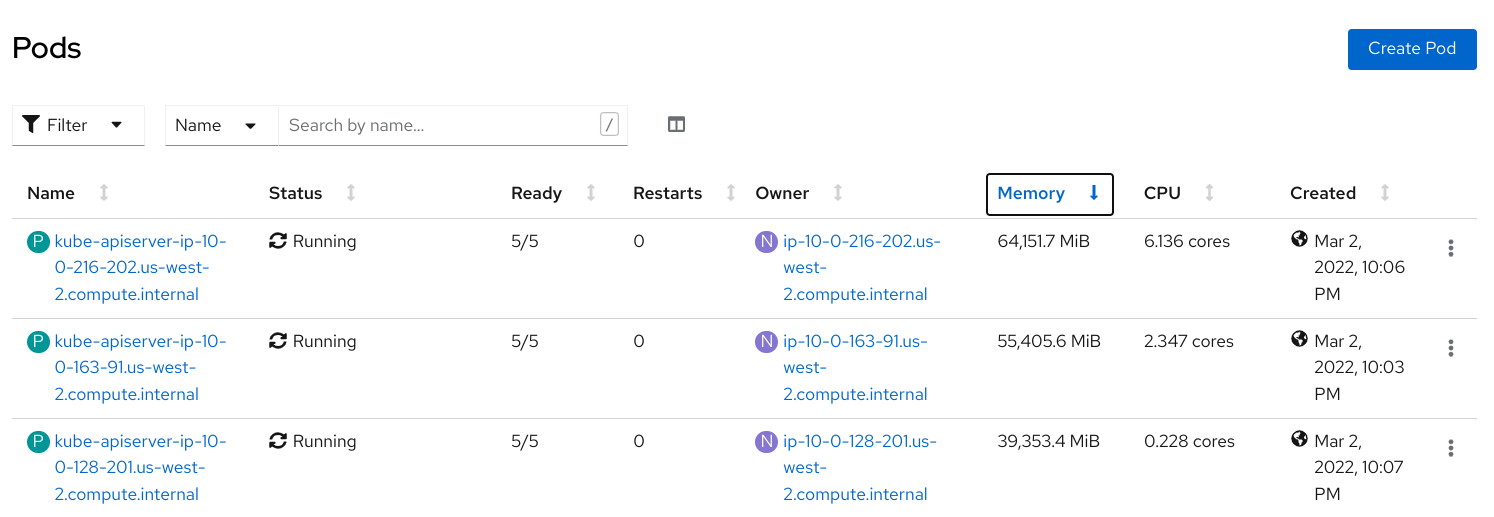
On clusters with very high resoruces, ODH Dashboard is causing high memory usage on openshift-kube-apiserver. This is creating memory pressure on OpenShift master nodes where those pods reside, rendering the cluster unreachable if it uses all available memory on the node.
Performance test was the default toolchain-e2e test for the sandbox. This will create lots of users, namespaces, and users.
https://github.com/codeready-toolchain/toolchain-e2e/tree/master/setup
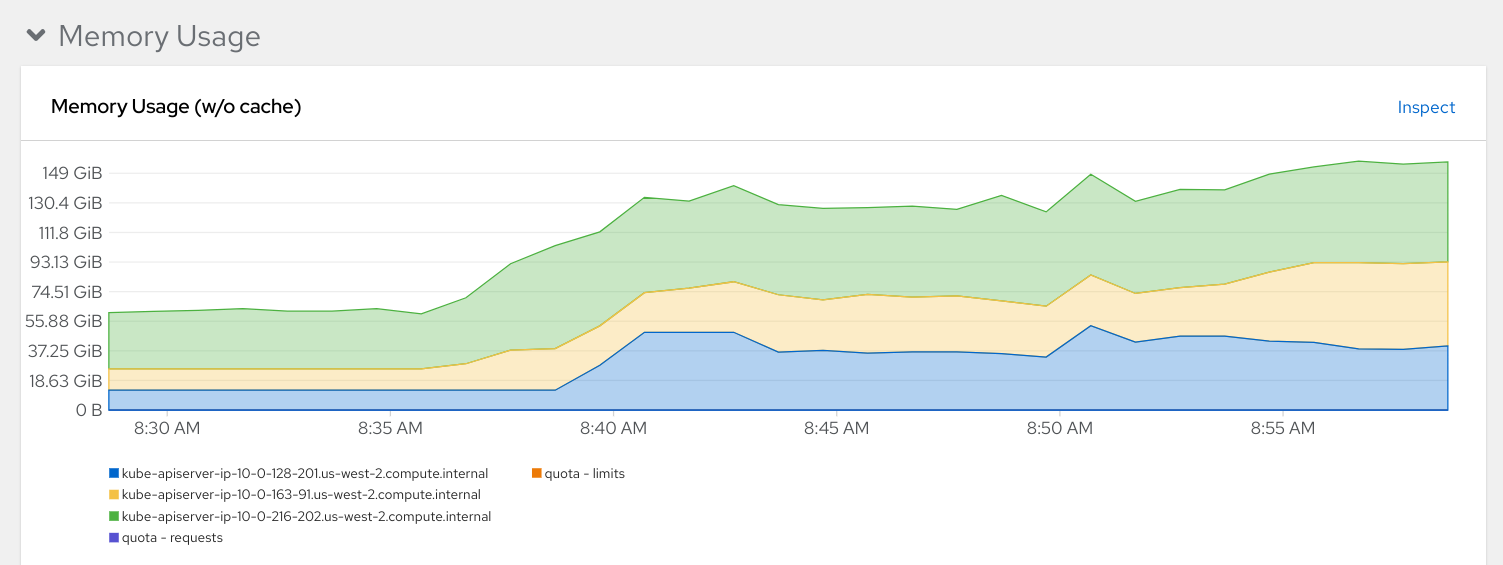
sum(container_memory_usage_bytes{namespace="openshift-kube-apiserver", pod=~"kube-apiserver-.*"}) amounted to 360GB of ram and individual pods were over 60GB.
https://docs.google.com/spreadsheets/d/1RKt9jtTtv4Ft3ZlVk4sszC-BrF_0dbC46_FNHiLTaI0/edit#gid=0
Prerequisites (if any, like setup, operators/versions):
Steps to Reproduce (
- create cluster with master nodes m5.8xlarge (https://github.com/codeready-toolchain/toolchain-e2e/tree/master/setup#prereqs)
- install RHODS
- Set up the sandbox operators (https://github.com/codeready-toolchain/toolchain-e2e/tree/master/setup#dev-sandbox-setup-1)
- run the tests (https://github.com/codeready-toolchain/toolchain-e2e/tree/master/setup#provisioning-test-users-and-capturing-metrics)
for 1 user, and for 2000 users and compare results
example:
go run setup/main.go -users 2000 --default 2000 --custom 0 --username "user${RANDOM_NAME}" --workloads redhat-ods-operator:rhods-operator --workloads redhat-ods-applications:rhods-dashboard --workloads redhat-ods-operator:cloud-resource-operator --workloads redhat-ods-monitoring:blackbox-exporter --workloads redhat-ods
monitoring:grafana --workloads redhat-ods-monitoring:prometheus - view the results
Actual results:
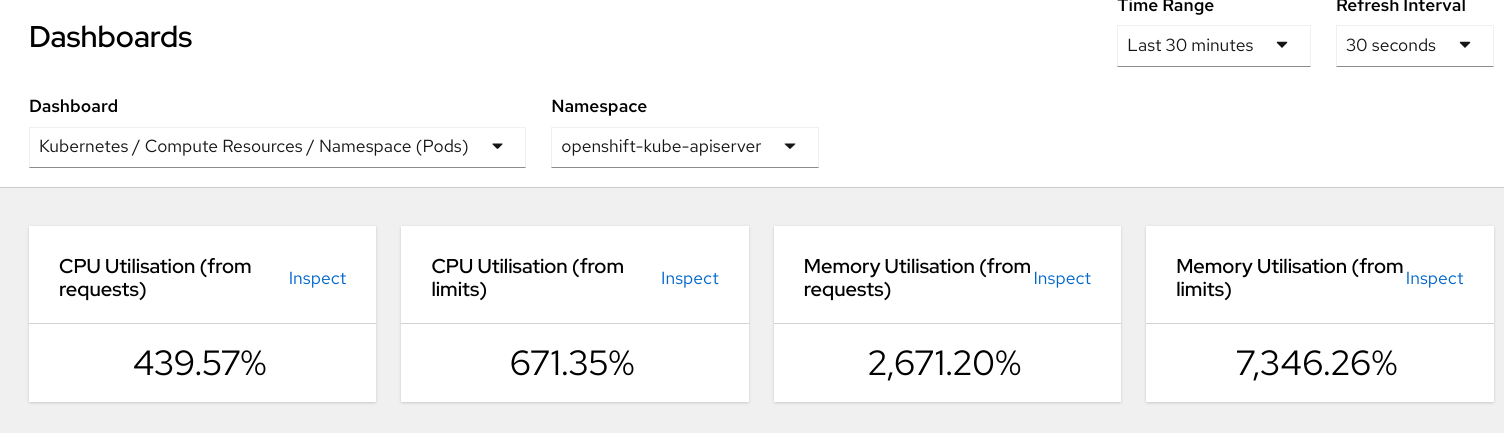
Resulting memory usage for Average openshift-kube-apiserver
and openshift-kube-apiserver are very high (300+ GB)
Average openshift-kube-apiserver: 418536.23 MB
Max openshift-kube-apiserver: 418536.23 MB
Usage with same resources on cluster before and after deploying dashboard:


Expected results:
Resulting memory usage for Average openshift-kube-apiserver
and openshift-kube-apiserver should stay under 100GB
Average openshift-kube-apiserver: 55374.12 MB
Max openshift-kube-apiserver: 89703.79 MB