-
Bug
-
Resolution: Done
-
Major
-
RHODS_1.1_GA
-
3
-
False
-
False
-
None
-
No
-
-
-
-
-
-
1.3.0-6
-
No
-
No
-
Yes
-
None
-
-
IDH Sprint 13
Description of problem:
In summary, it looks like if you make a long running jupyternotebook test (3h) the alert "RHODS Route Error Burn Rate (for 3h)" fires for jupyterhub, even if jupyterhub works fine during that time
Prerequisites (if any, like setup, operators/versions):
Steps to Reproduce
We have seen that, if you run the jenkins job to check PRs (rhods-ci-pr-test), the prometheus alert "RHODS Route Error Burn Rate" (for 3h) is activated as PENDING (yellow color).
As the jenkins job takes 1h 30 mins, if you run it again the same alert is activated as FIRING (red color).
The jenkins job doesn't do anything destructive to the cluster, is running jupyterhub notebooks and performing other actions. So, in my opinion, this alert shouldn't be firing, specially if they send pages to the SRE team (I'm not sure if they do, but probably)
IMPORTANT: even when the was alert was firing Jupypterhub seemed to work fine.
I've done the test today in this cluster (adding Anish and Maulik as cluster-admins):
https://console-openshift-console.apps.ods-qe-b2.sr2s.s1.devshift.org/
More info:
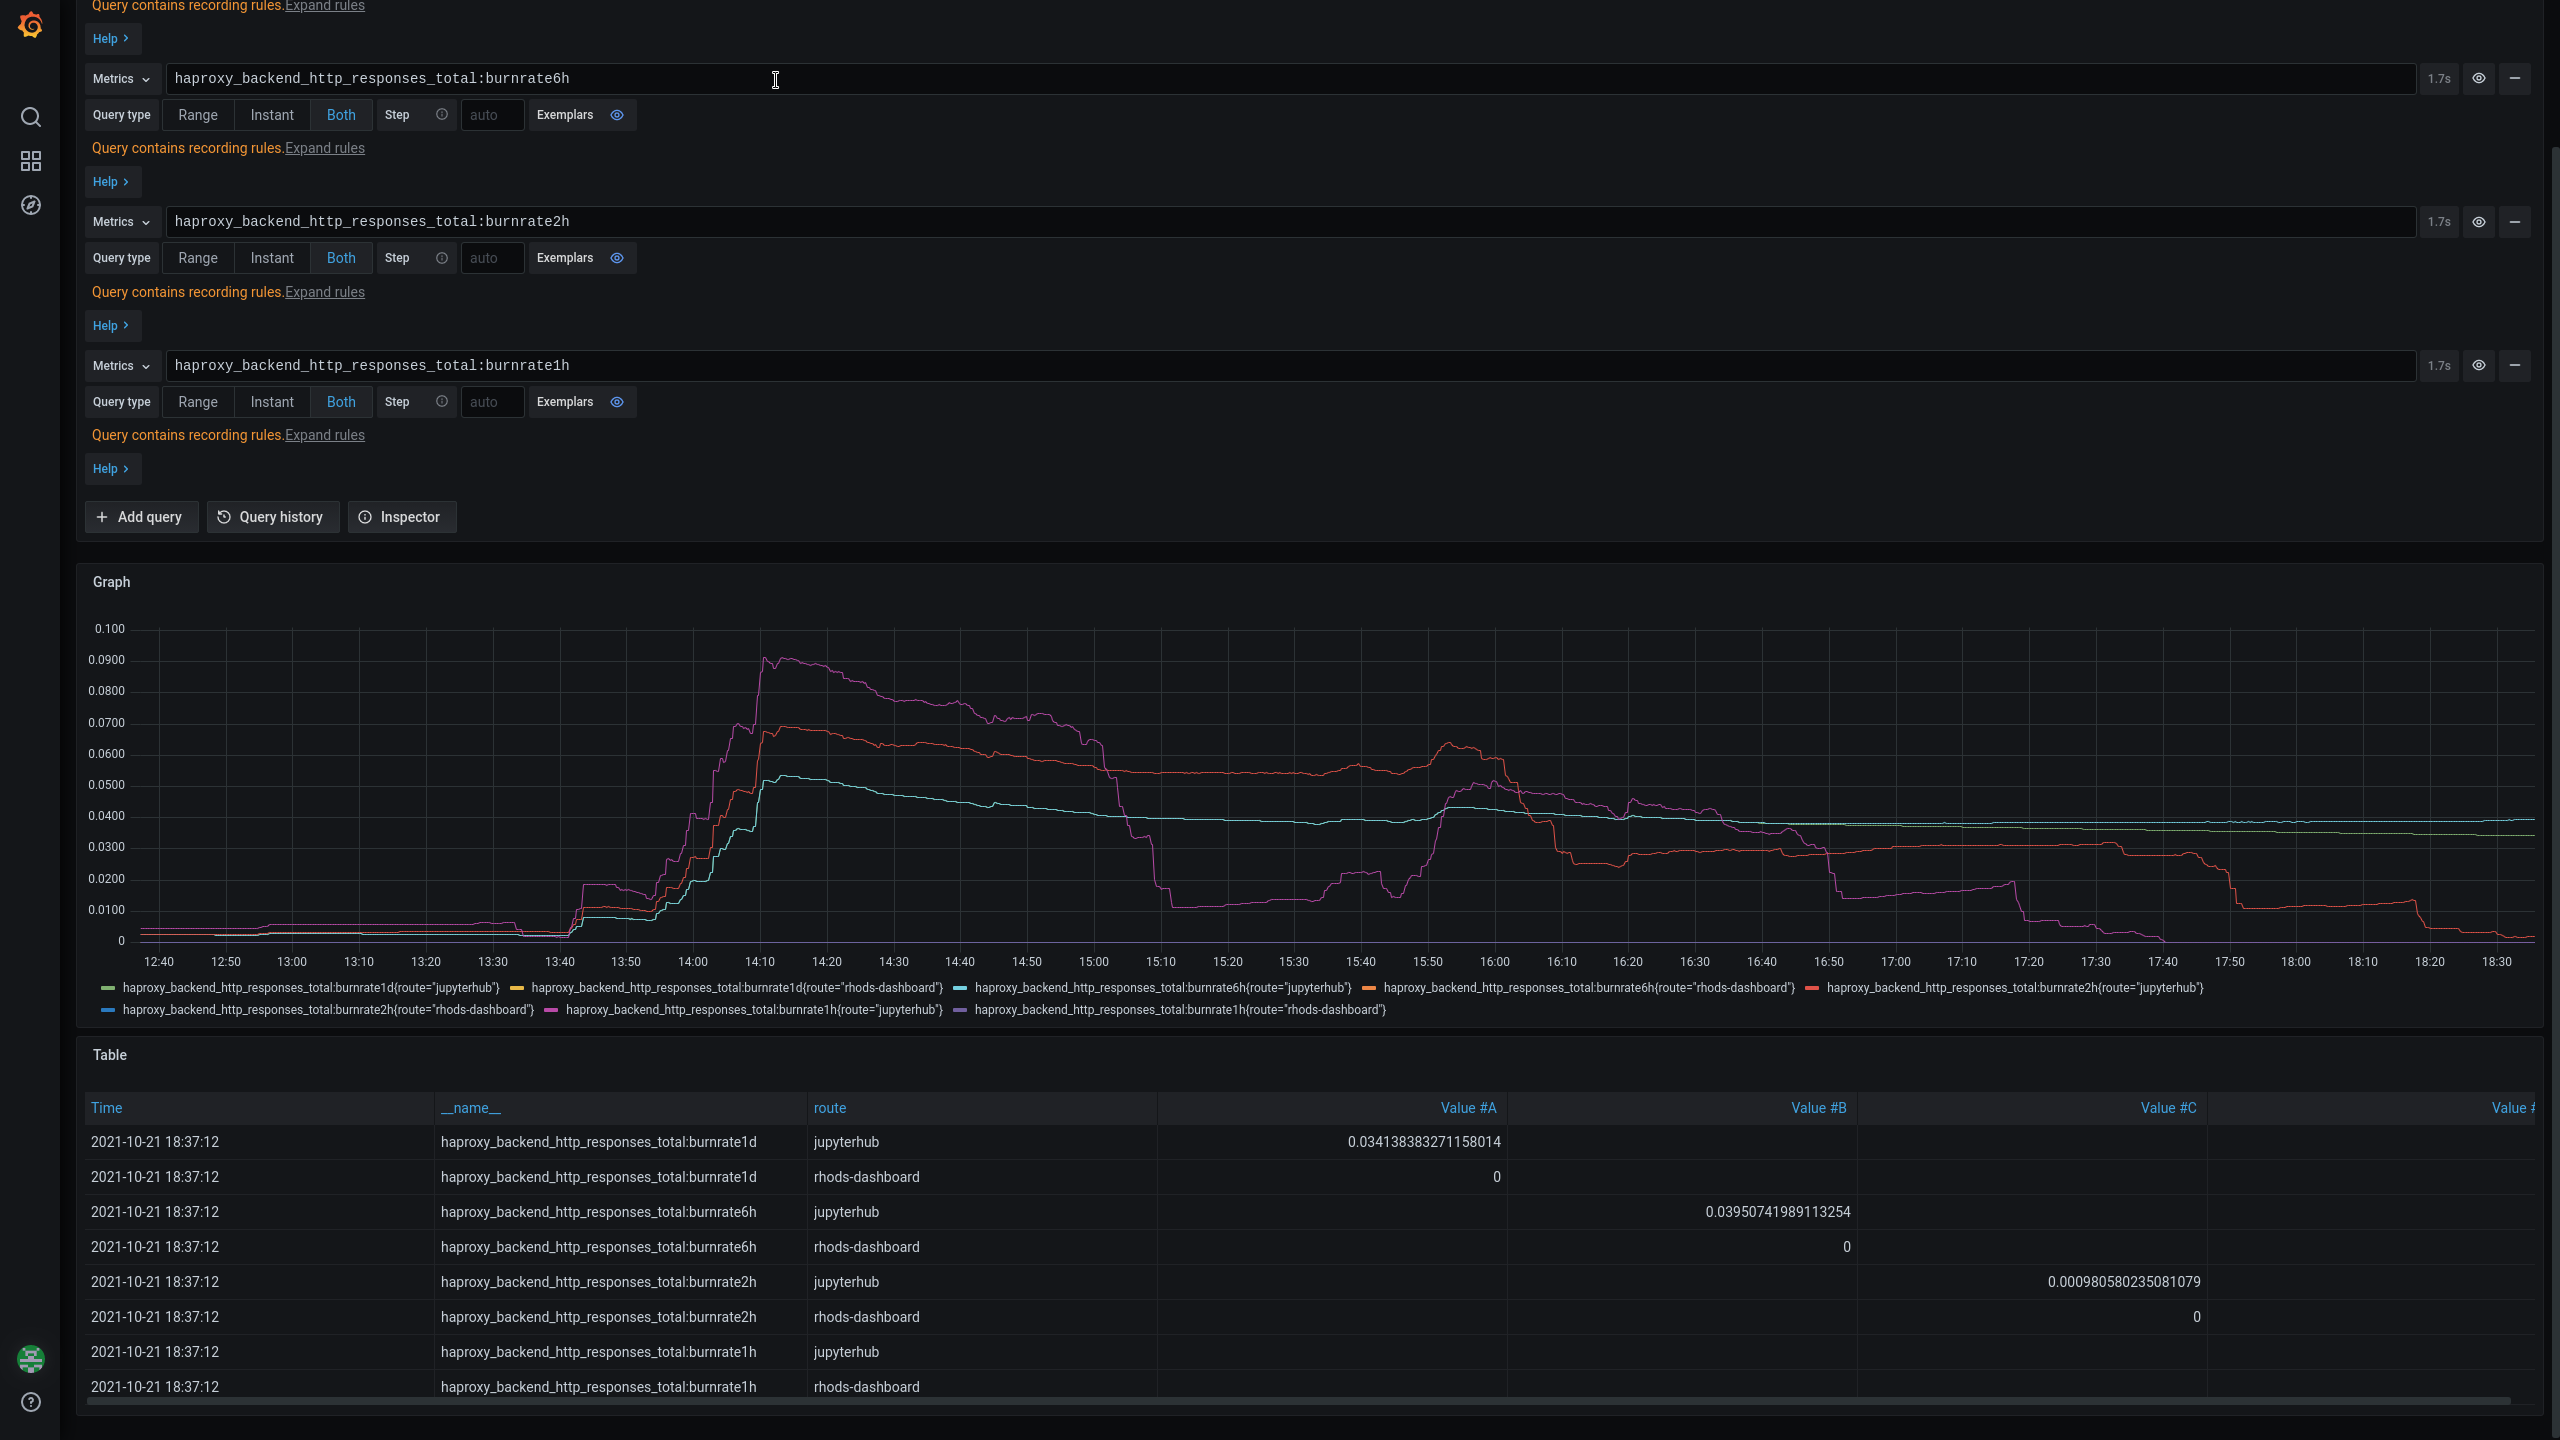
The first PR job was started at 13:31. We see in Grafana that a few minutes after, the haproxy_backend_http_responses_total:burnrate1h, 2h and 6h start to be over 0
- haproxy_backend_http_responses_total:burnrate1h {route="jupytehub"} (purple color in the image)
- haproxy_backend_http_responses_total:burnrate2h {route="jupytehub"} (red color in the image)
- haproxy_backend_http_responses_total:burnrate6h {route="jupytehub"} (cyan color in the image)
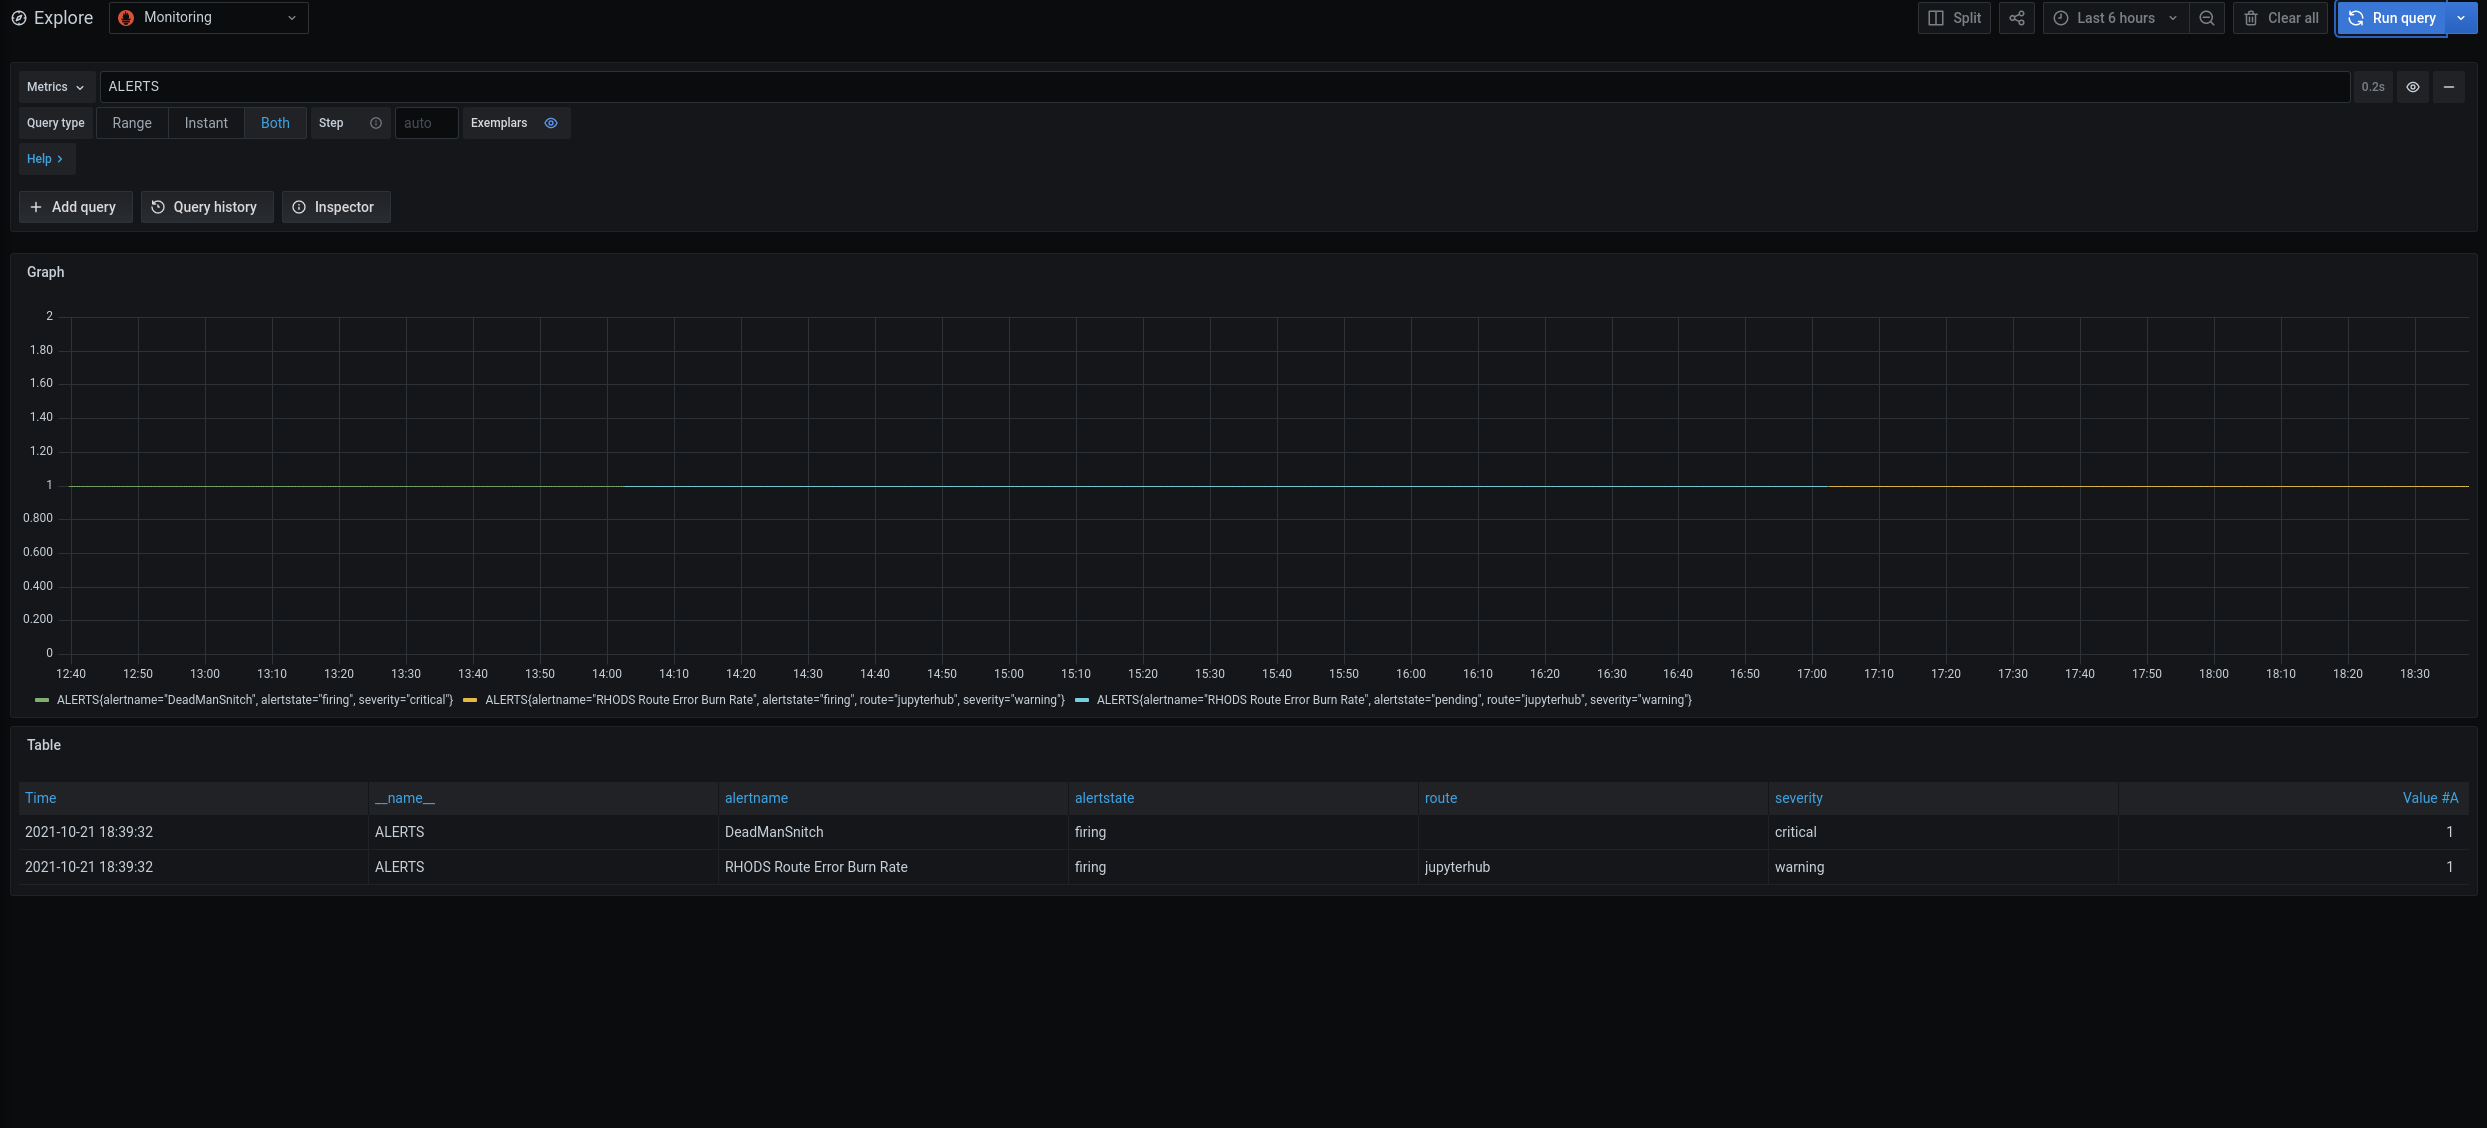
At 14:02 "RHODS Route Error Burn Rate" (for 3h) is activated as PENDING (yellow color). At 15:23 I start the 2n jenkins job. We can see that a few minutes after the burnrateX values raise again
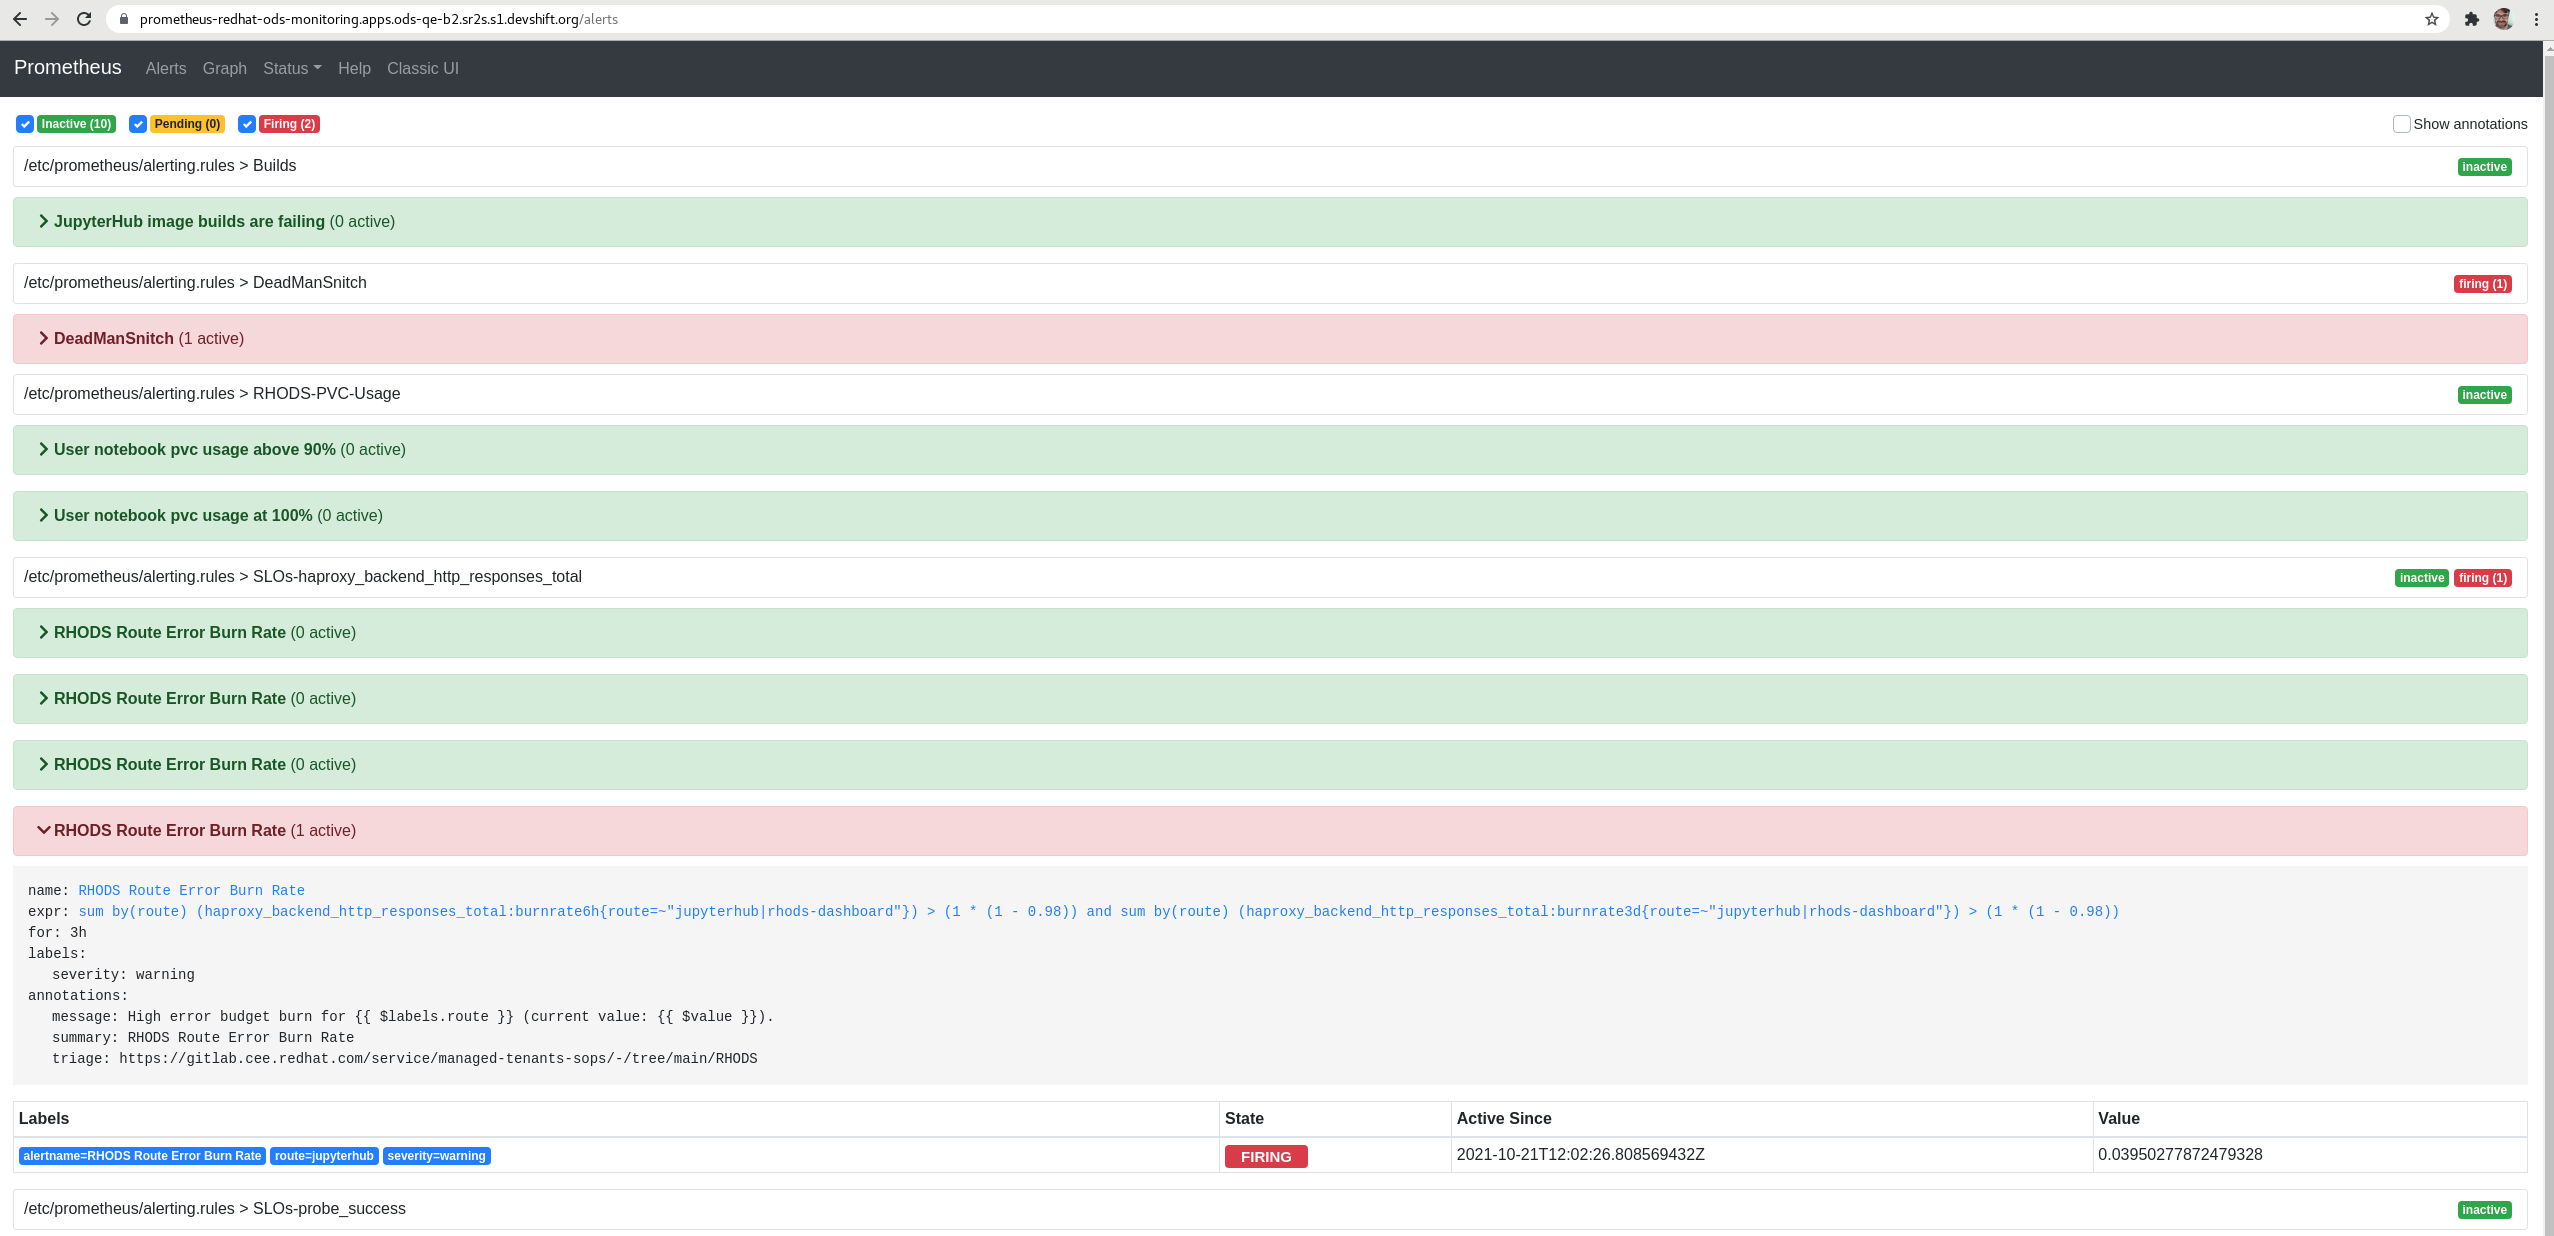
At 17:03 "RHODS Route Error Burn Rate" (for 3h) is activated as FIRING (red color)


Actual results:
Expected results:
Reproducibility (Always/Intermittent/Only Once):
I found the same behavior in 2 different clusterss
Build Details:
RHODS 1.1.1-57 installed using our script