-
Bug
-
Resolution: Not a Bug
-
Critical
-
None
-
RHODS_1.1_GA
-
None
-
False
-
False
-
None
-
No
-
-
-
-
-
-
No
-
No
-
Yes
-
None
-
Description of problem:
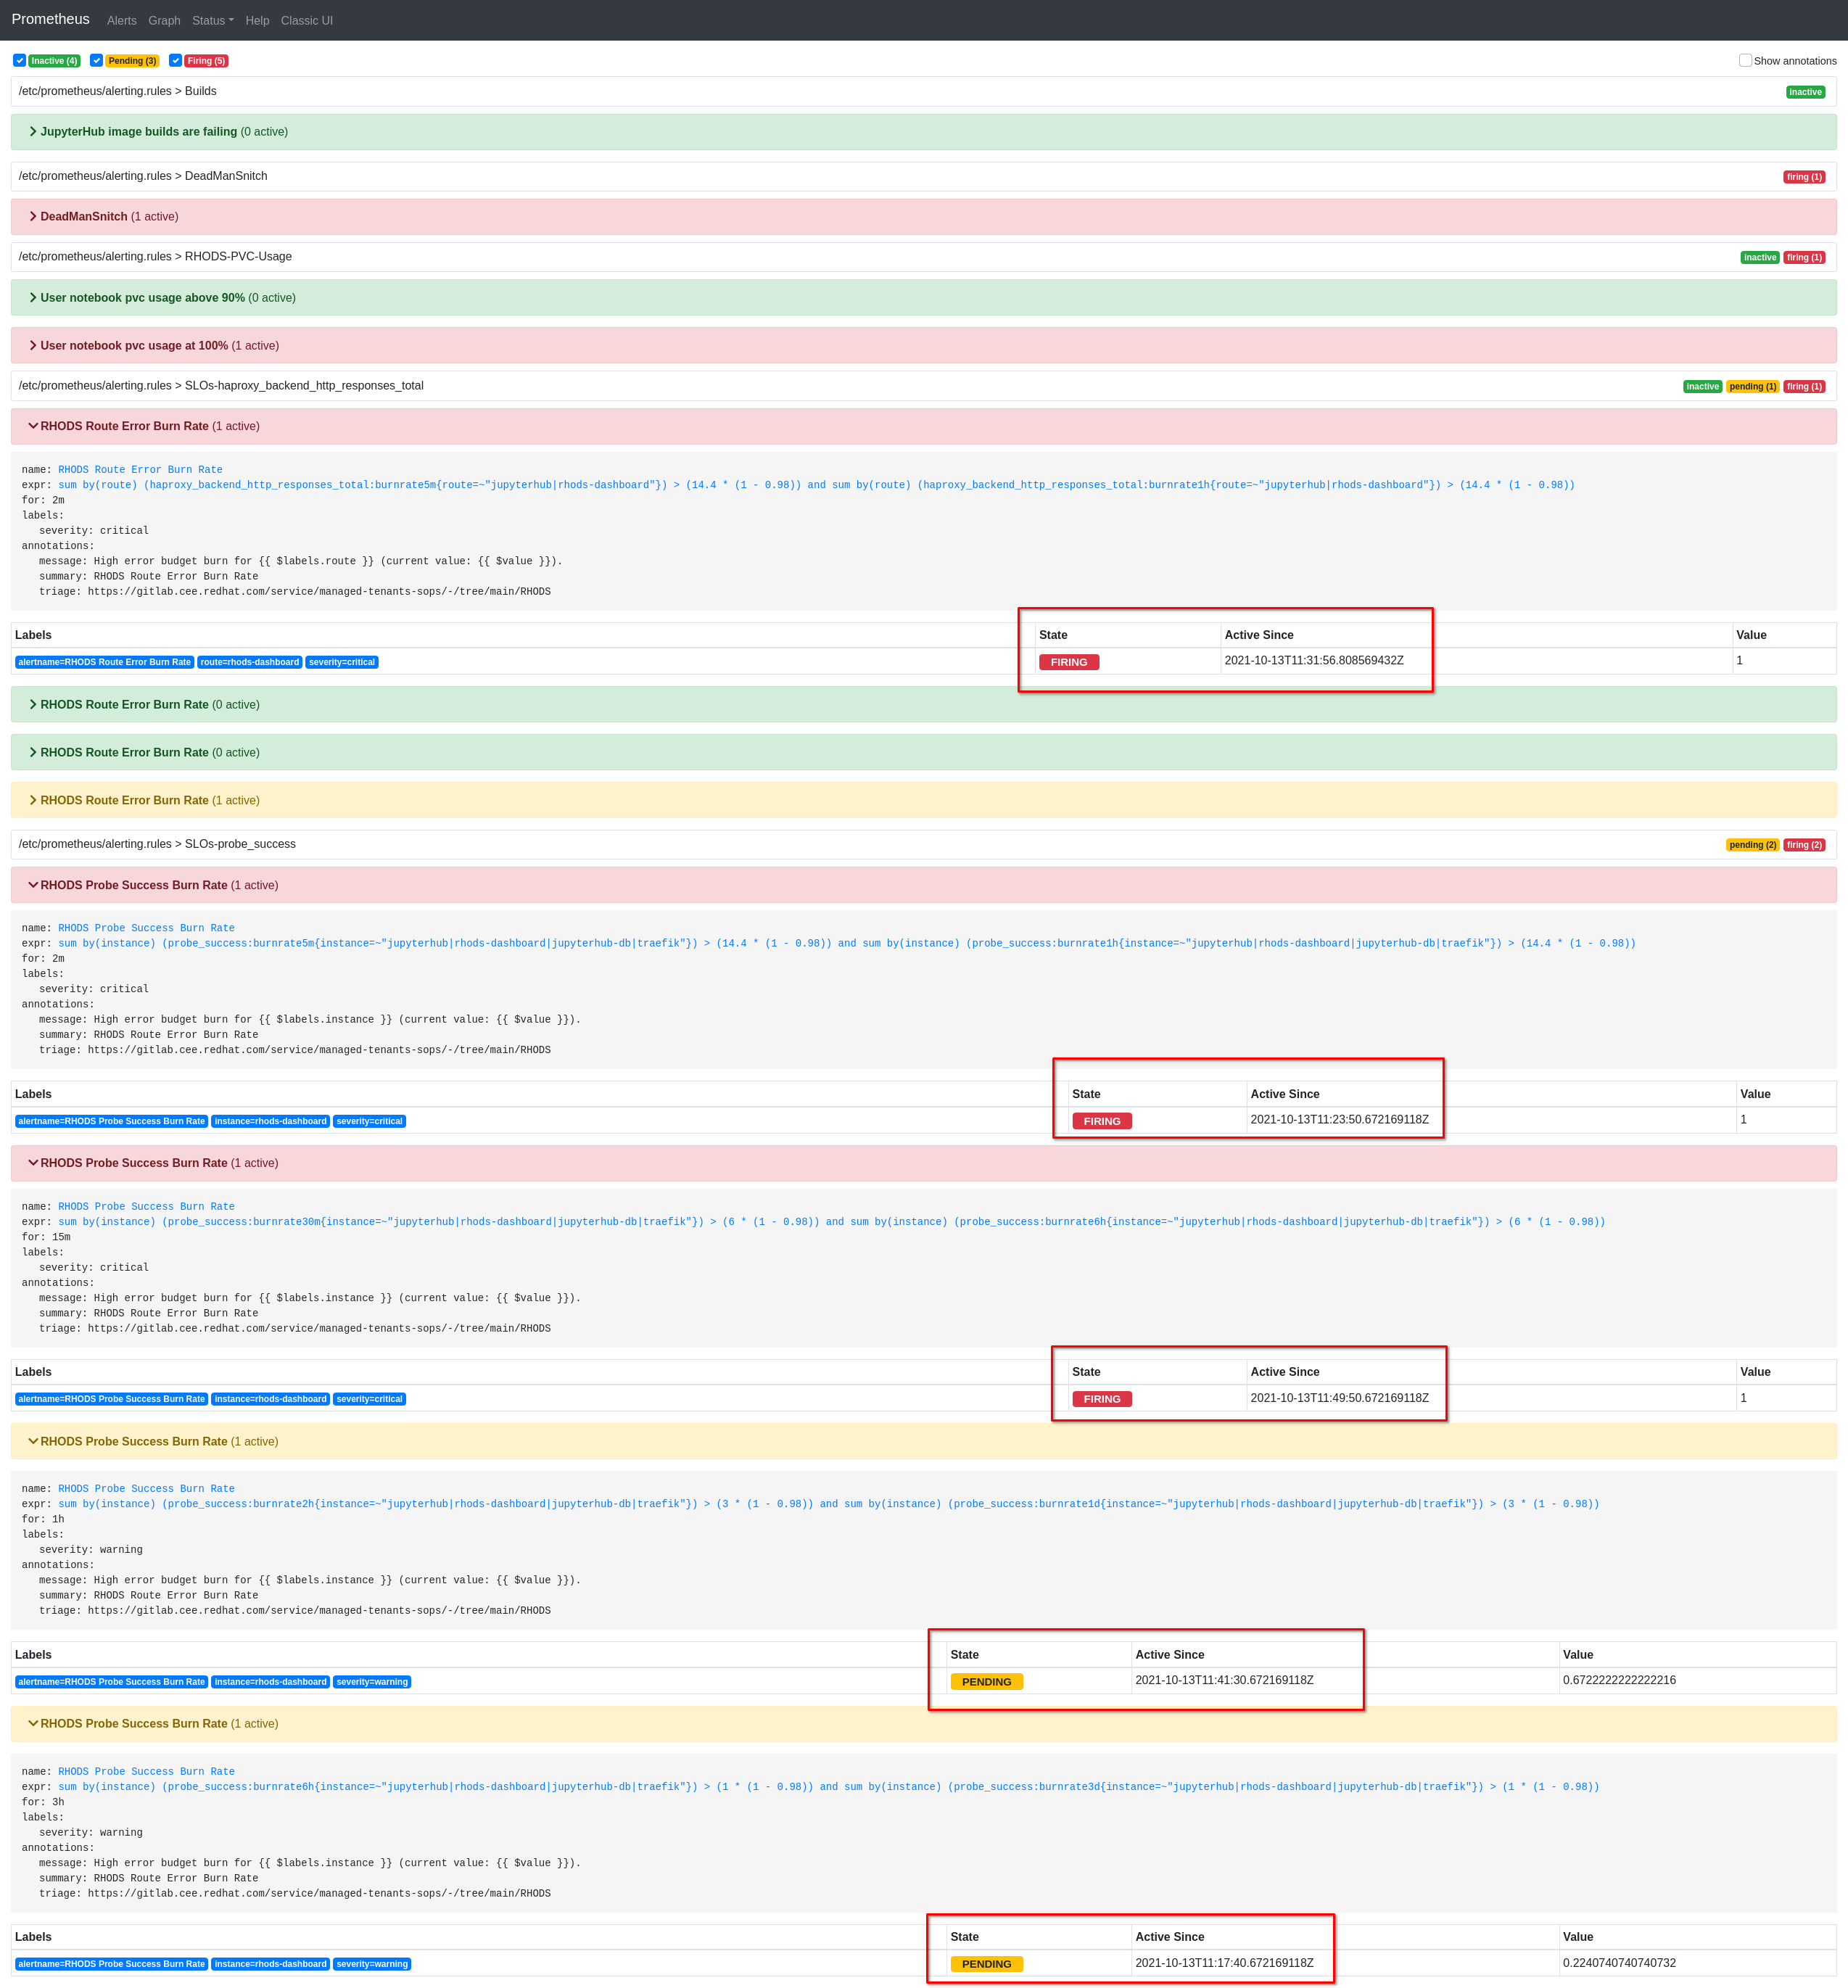
I believe The prometheus alerts RHODS Route Error Burn Rate and RHODS Probe Success Burn Rate take can take more than 15 minutes to activate when rhods-dashboard is down.
I believe this is too long, considering that the availability should be 98%
Prerequisites (if any, like setup, operators/versions):
Steps to Reproduce
- Go to RHODS-Dashboard an verify it's working properly
- Log in to Prometheus
- Prometheus > Alerts
- Verify that alerts RHODS Route Error Burn Rate and RHODS Probe Success Burn Rate are not active
- In order to provoke a disruption in the service:
- Log in To OpenShift's Console
- Workloads > Deployments:
- Scale down rhods-operator to 0 pods
- Scale down traefik-proxy to 0 pods
- Refresh once RHODS-Dashboard an verify it's no longer available
- Refresh Prometheus > Alerts every minute to see when the alerts are being fired
Actual results:
- 13:06 Scale down to 0 rhods-operator and rhods-dashboard
- 13:17 RHODS Probe Success Burn Rate (for 3h) alert PENDING
- 13:23 RHODS Probe Success Burn Rate (for 2m) alert PENDING
- 13:26 RHODS Probe Success Burn Rate (for 2m) alert FIRING
- 13:31 RHODS Route Error Burn Rate (2m) alert FIRING
See this screenshot taken at 14:28 (more than 1 hour since rhods-dashboard is down)

Refresh Prometheus > Alerts every minute to see when the alerts are being fired
Expected results:
Reproducibility (Always/Intermittent/Only Once):
Build Details:
Workaround:
Additional info:
- blocks
-
RHODS-268 Configure Prometheus alerts for RHODS SLOs
-
- Closed
-