-
Story
-
Resolution: Done
-
 Critical
-
RHODS_1.1_GA
-
1
-
False
-
False
-
None
-
No
-
-
-
-
-
-
1.1.1
-
No
-
undefined
-
No
-
Yes
-
-
IDH Sprint 7
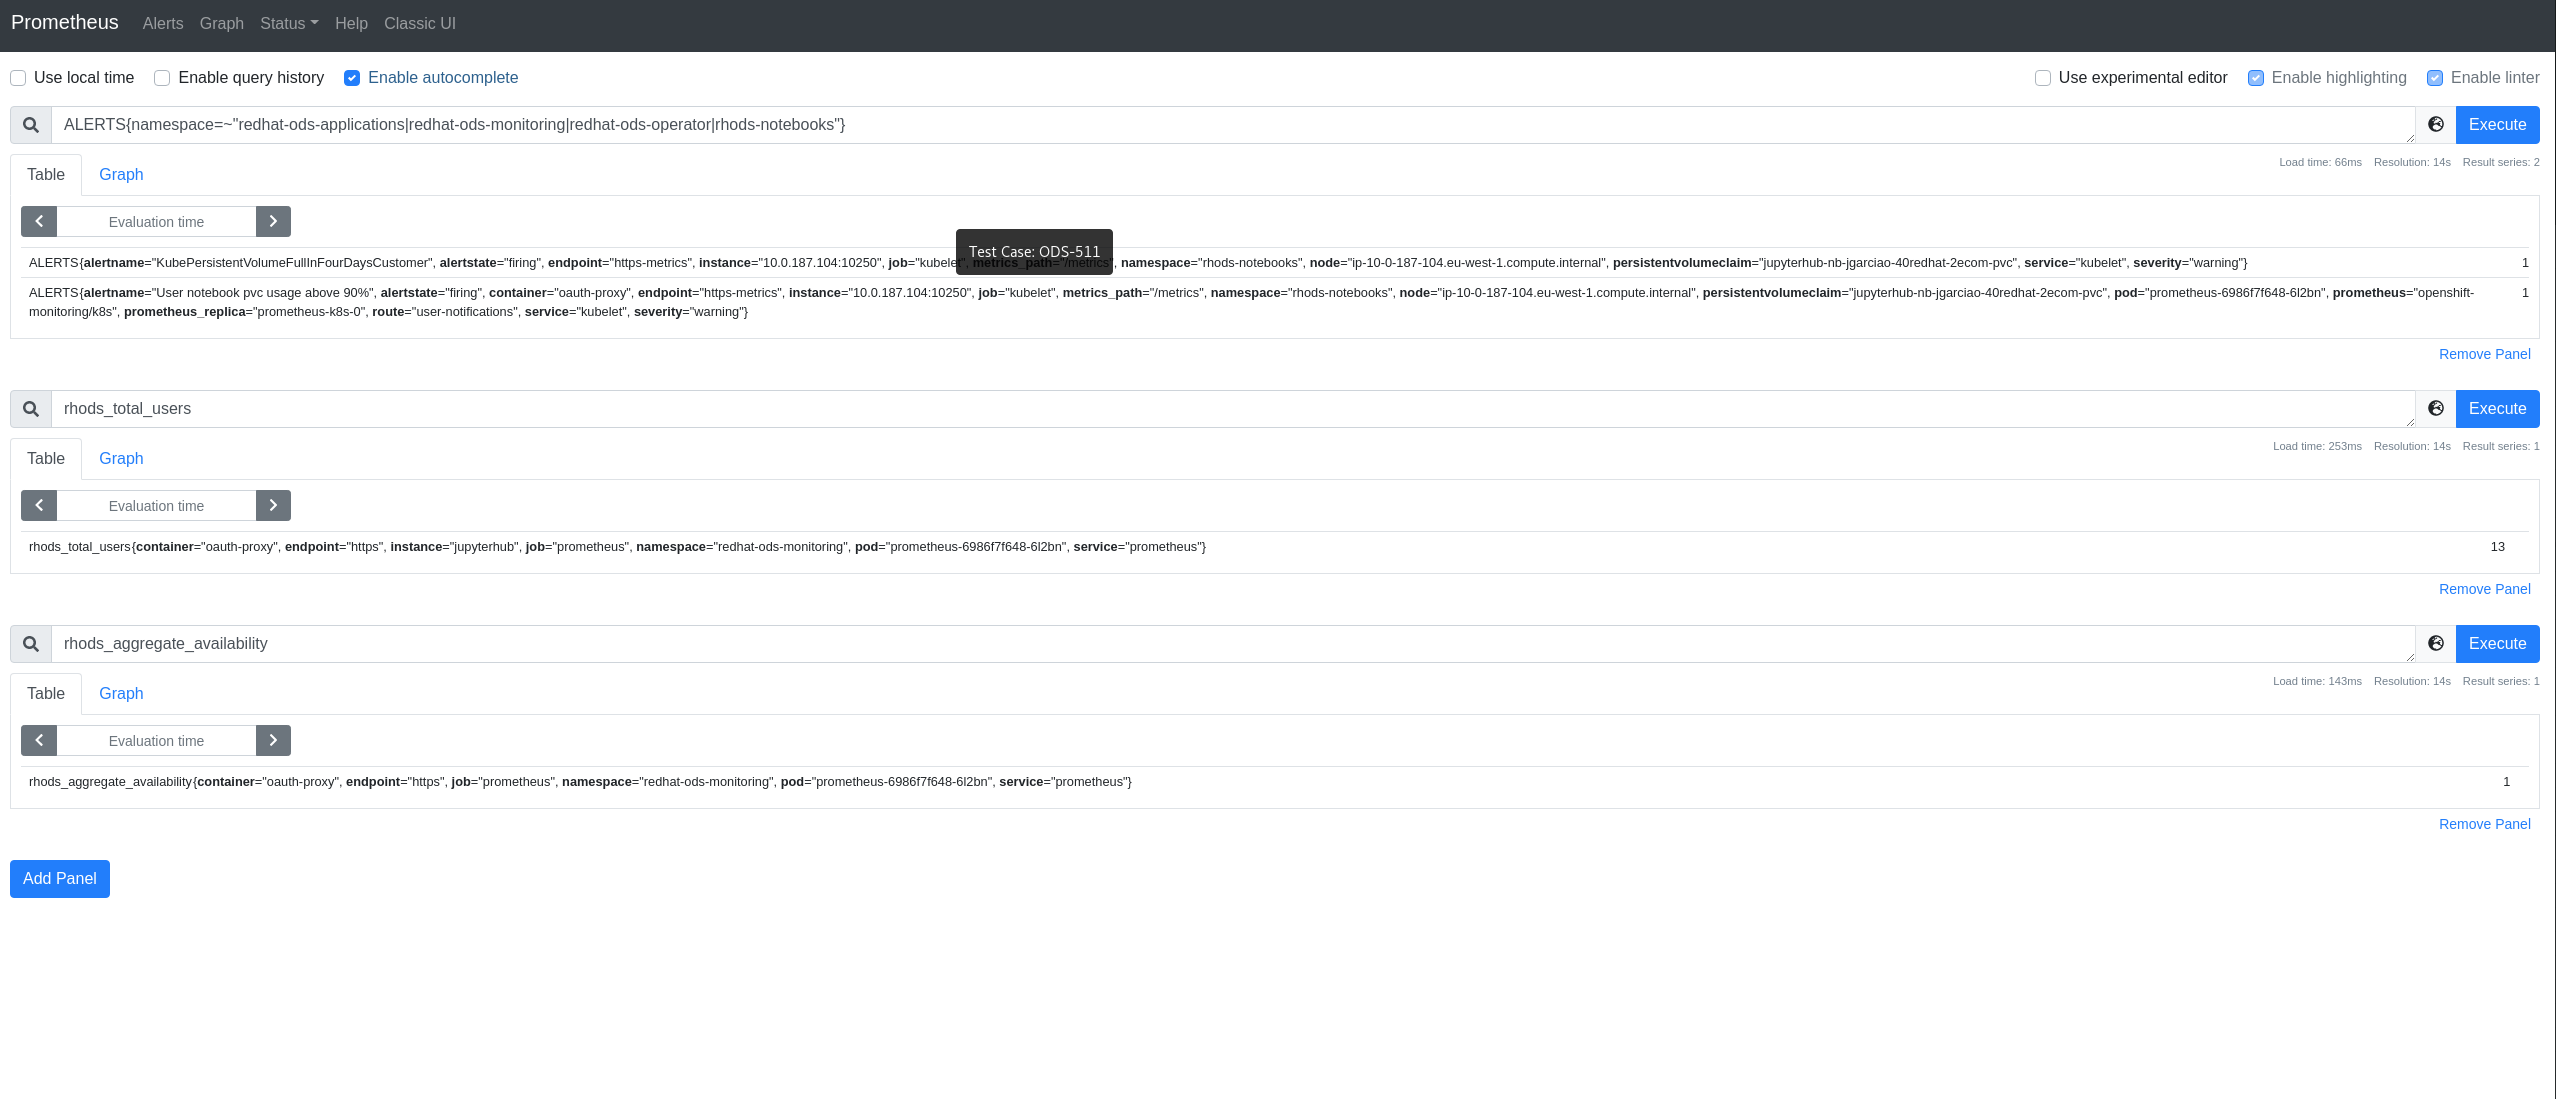
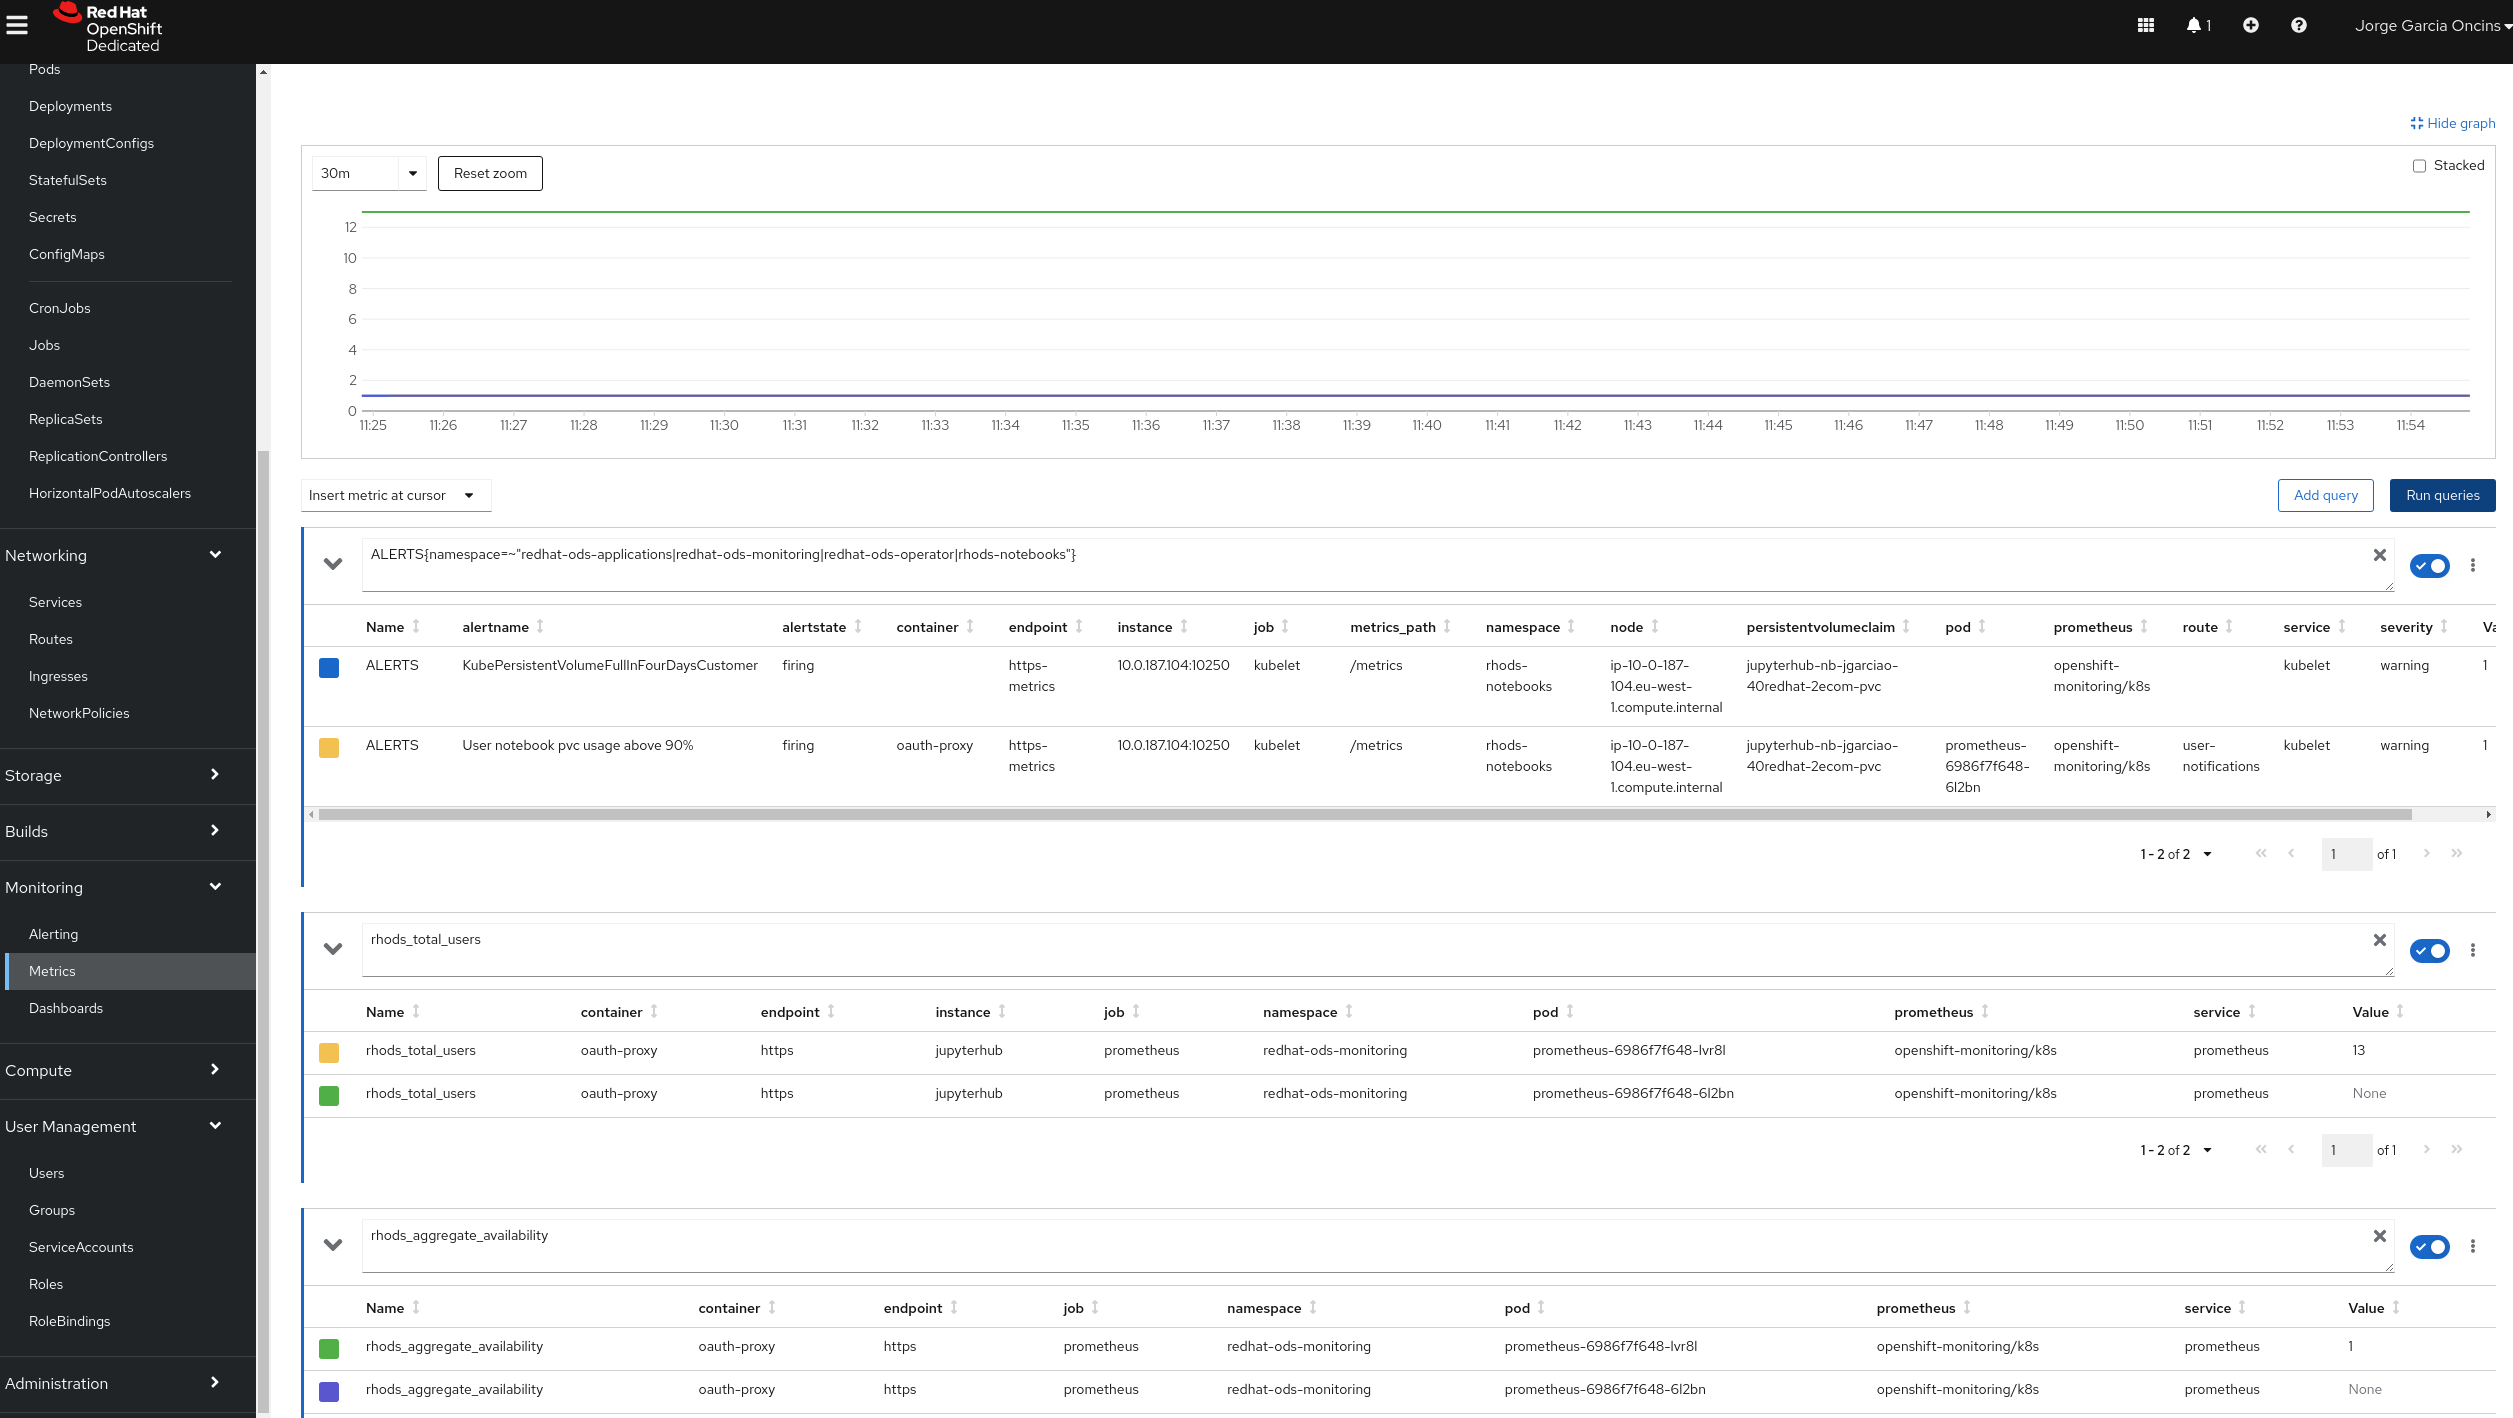
The MT-SRE team wants to be able to create a Grafana dashboard from the Telemetry data at telemeter-lts-dashboards.datahub.redhat.com that shows whether RHODS is meeting its SLOs. In order to do this, we will need to federate the "alerts" metric from our RHODS prometheus instance to the cluster monitoring prometheus instance in OpenShift.
Add "alerts" to the list of metrics here.