-
Bug
-
Resolution: Unresolved
-
 Minor
Minor
-
None
-
None
-
True
-
-
False
-
Low
Description of problem:
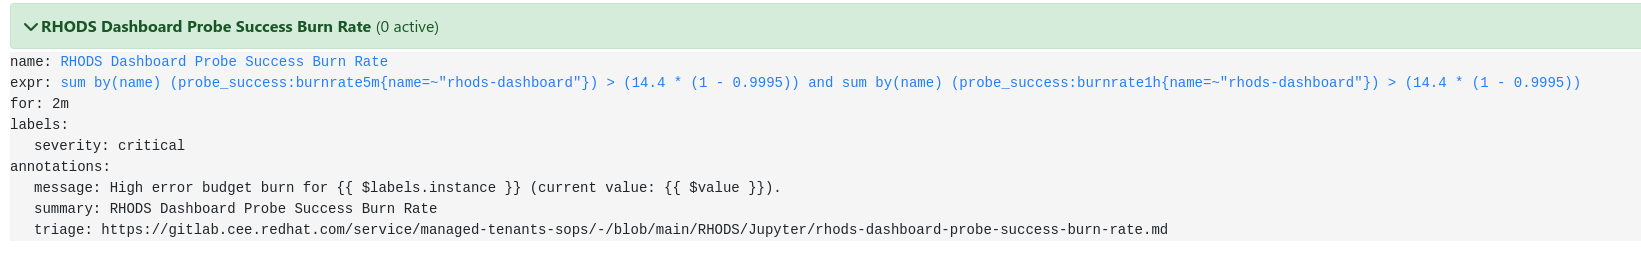
Provided triage url for alert RHODS Dashboard Probe Success Burn Rate is pointing to a broken link https://gitlab.cee.redhat.com/service/managed-tenants-sops/-/blob/main/RHODS/Jupyter/rhods-dashboard-probe-success-burn-rate.md
I think it should be pointing at https://gitlab.cee.redhat.com/service/managed-tenants-sops/-/blob/main/RHODS/RHODS-Dashboard/rhods-dashboard-probe-success-burn-rate.md

Also, the triage url for alerts User notebook pvc usage above 90% and User notebook pvc usage at 100% is https://gitlab.cee.redhat.com/service/managed-tenants-sops/-/tree/main/RHODS but I don't see any instructions there to fix the alert. Note: this issue is meant to be fixed by end-users. There is a solution documented here: https://access.redhat.com/documentation/en-us/red_hat_openshift_data_science/1/html/working_with_notebooks/troubleshooting-common-problems-in-jupyterhub-for-administrators_nb-server#the_user_receives_a_emphasis_role_strong_database_or_disk_is_full_emphasis_error_or_a_emphasis_role_strong_no_space_left_on_device_emphasis_error_when_they_run_notebook_cells
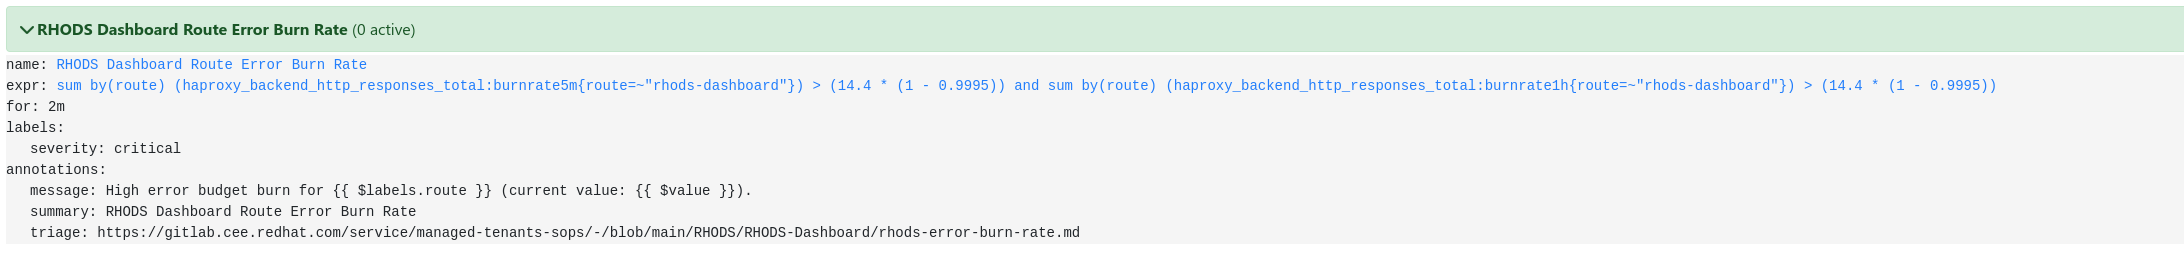
Finally, the text for the SOP related to alert RHODS Dashboard Route Error Burn Rate could be improved:
- triage url: https://gitlab.cee.redhat.com/service/managed-tenants-sops/-/blob/main/RHODS/RHODS-Dashboard/rhods-error-burn-rate.md
- In the SOP, the name of the alert should be "RHODS Dashboard Route Error Burn Rate"
- Steps are not provided. Related doc rhods-probe-success-burn-rate.md is mentioned but it could be linked for easier access
Build Details:
RHODS 1.16.0-5
- relates to
-
-

- Backlog
-
- links to

