-
Bug
-
Resolution: Done-Errata
-
 Major
Major
-
None
-
389-ds-base-3.1.3-2.el10
-
No
-
Moderate
-
rhel-idm-ds
-
0
-
False
-
False
-
-
Yes
-
None
-
Pass
-
RegressionOnly
-
Bug Fix
-
-
Done
-
Unspecified
-
Unspecified
-
Unspecified
-
None
Description of a problem
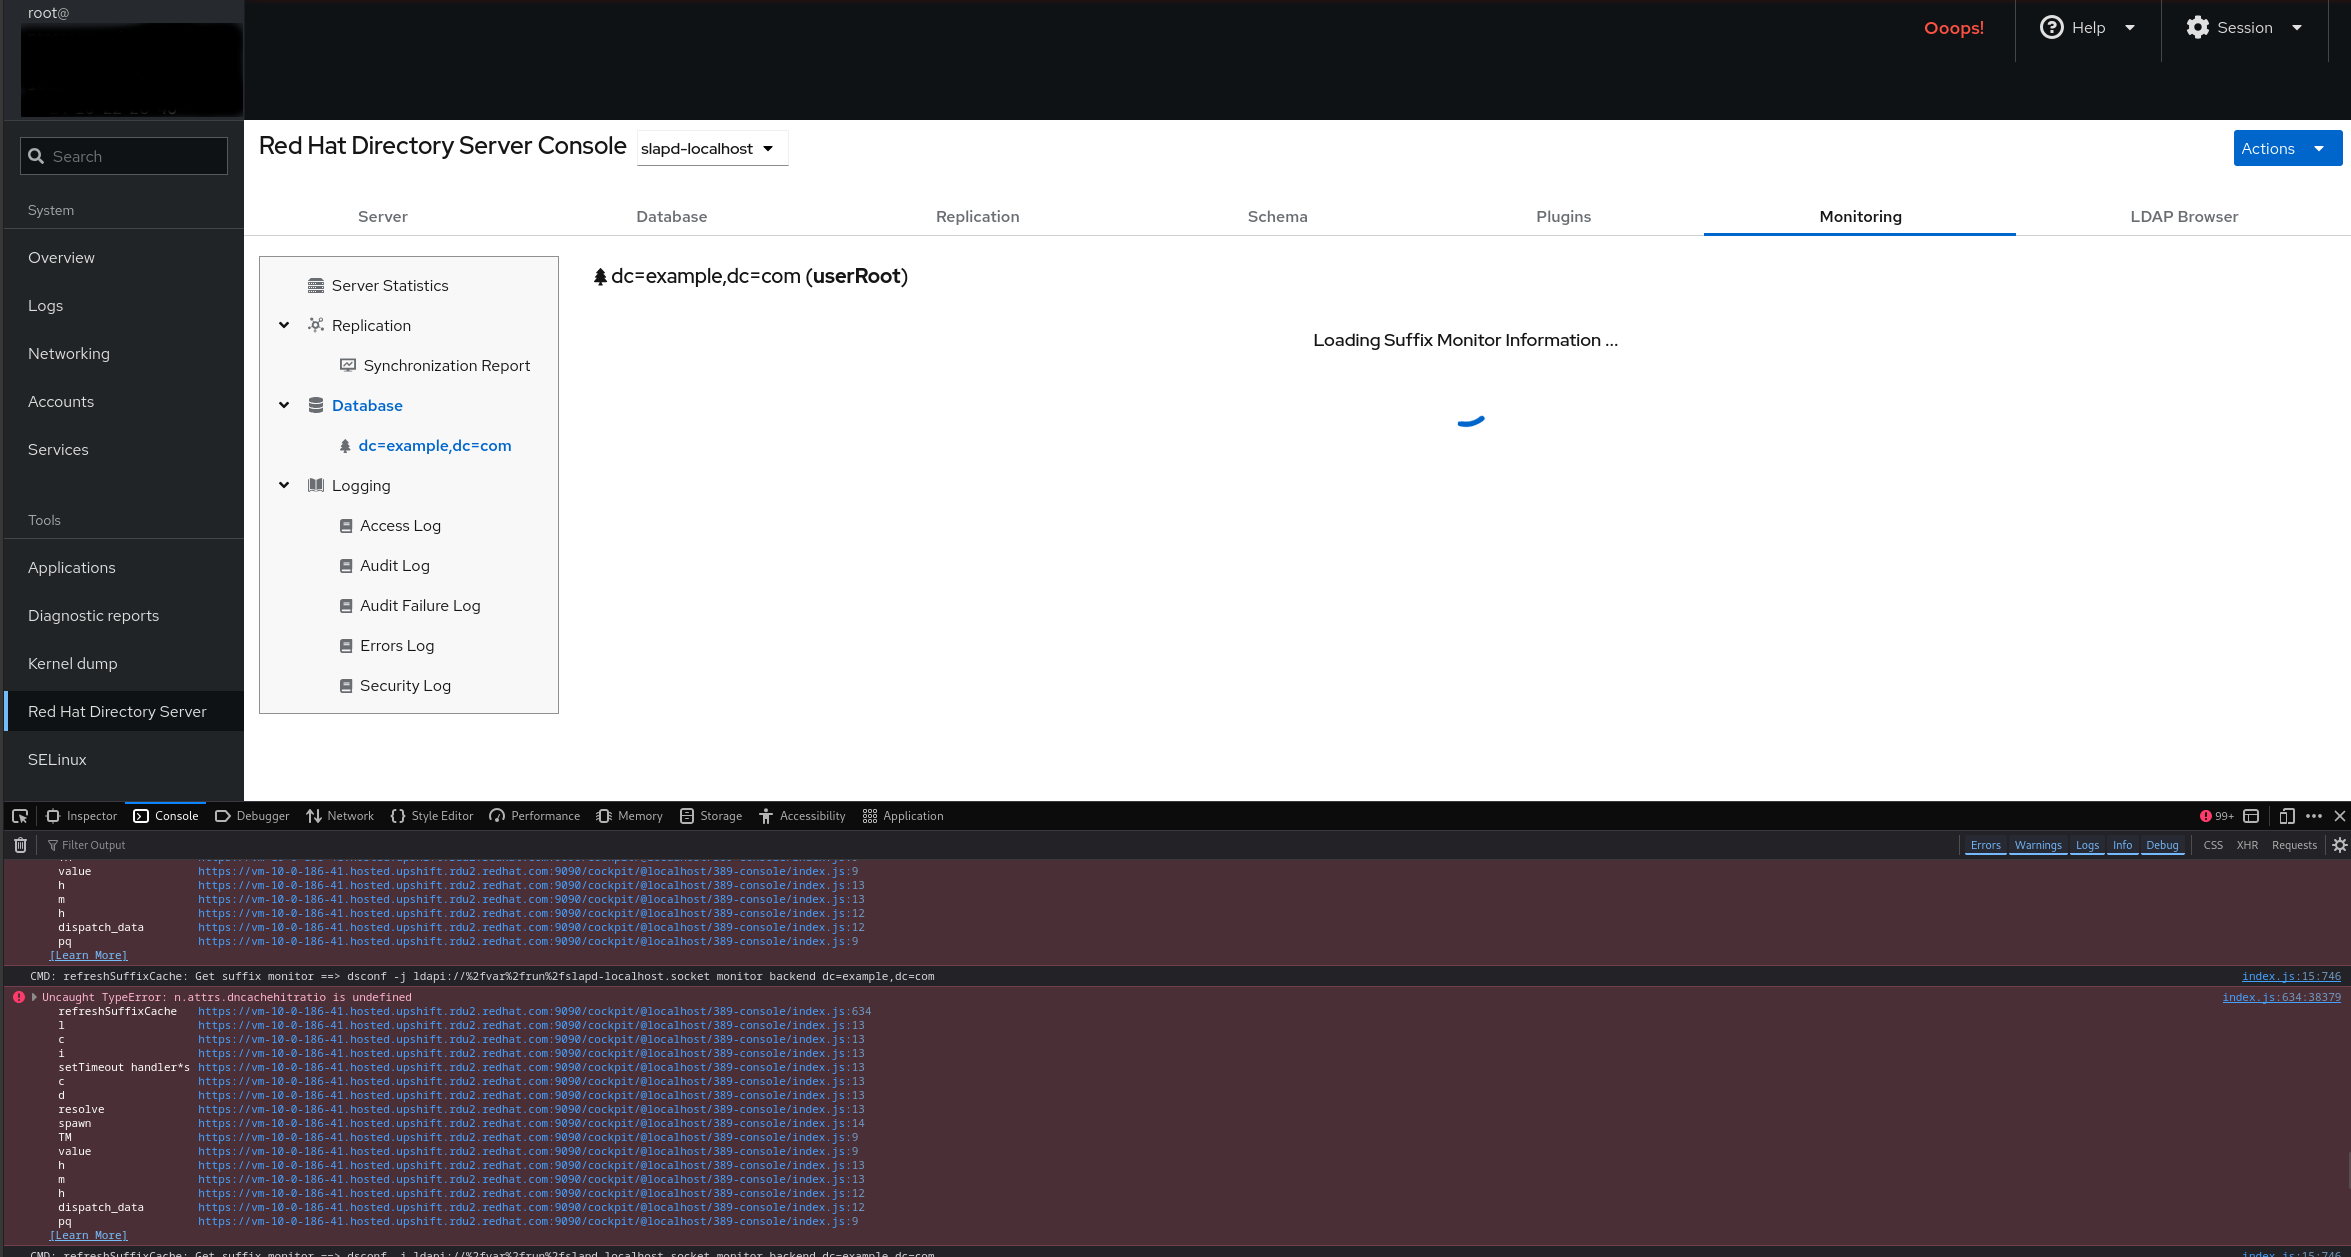
Monitoring info on database suffix on instance with mdb database does not work.
Version-Release number of the selected component
rpm -q 389-ds-base cockpit-389-ds
389-ds-base-3.0.4-3.el10.x86_64
cockpit-389-ds-3.0.4-6.el10dsrv.noarch
Browser (if applicable)
Firefox
Steps to reproduce
1. Create instance with mdb database
2. Open WebUI, go to Monitoring tab
3. Go to Database -> dc=example, dc=com
Actual results
Reports "Loading Suffix Monitor Information ..." and shows Ooops!

Console output:
Uncaught TypeError: n.attrs.dncachehitratio is undefined
refreshSuffixCache ...:9090/cockpit/@localhost/389-console/index.js:634
l ...:9090/cockpit/@localhost/389-console/index.js:13
c ...:9090/cockpit/@localhost/389-console/index.js:13
i ...:9090/cockpit/@localhost/389-console/index.js:13
setTimeout handler*s ...:9090/cockpit/@localhost/389-console/index.js:13
c ...:9090/cockpit/@localhost/389-console/index.js:13
d ...:9090/cockpit/@localhost/389-console/index.js:13
resolve ...:9090/cockpit/@localhost/389-console/index.js:13
spawn ...:9090/cockpit/@localhost/389-console/index.js:14
TM ...:9090/cockpit/@localhost/389-console/index.js:9
value ...:9090/cockpit/@localhost/389-console/index.js:9
h ...:9090/cockpit/@localhost/389-console/index.js:13
m ...:9090/cockpit/@localhost/389-console/index.js:13
h ...:9090/cockpit/@localhost/389-console/index.js:12
dispatch_data ...:9090/cockpit/@localhost/389-console/index.js:12
pq ...:9090/cockpit/@localhost/389-console/index.js:9index.js:634:38379
CMD: refreshSuffixCache: Get suffix monitor ==> dsconf -j ldapi://%2fvar%2frun%2fslapd-localhost.socket monitor backend dc=example,dc=com
Expected results
Should show monitoring info
Additional information
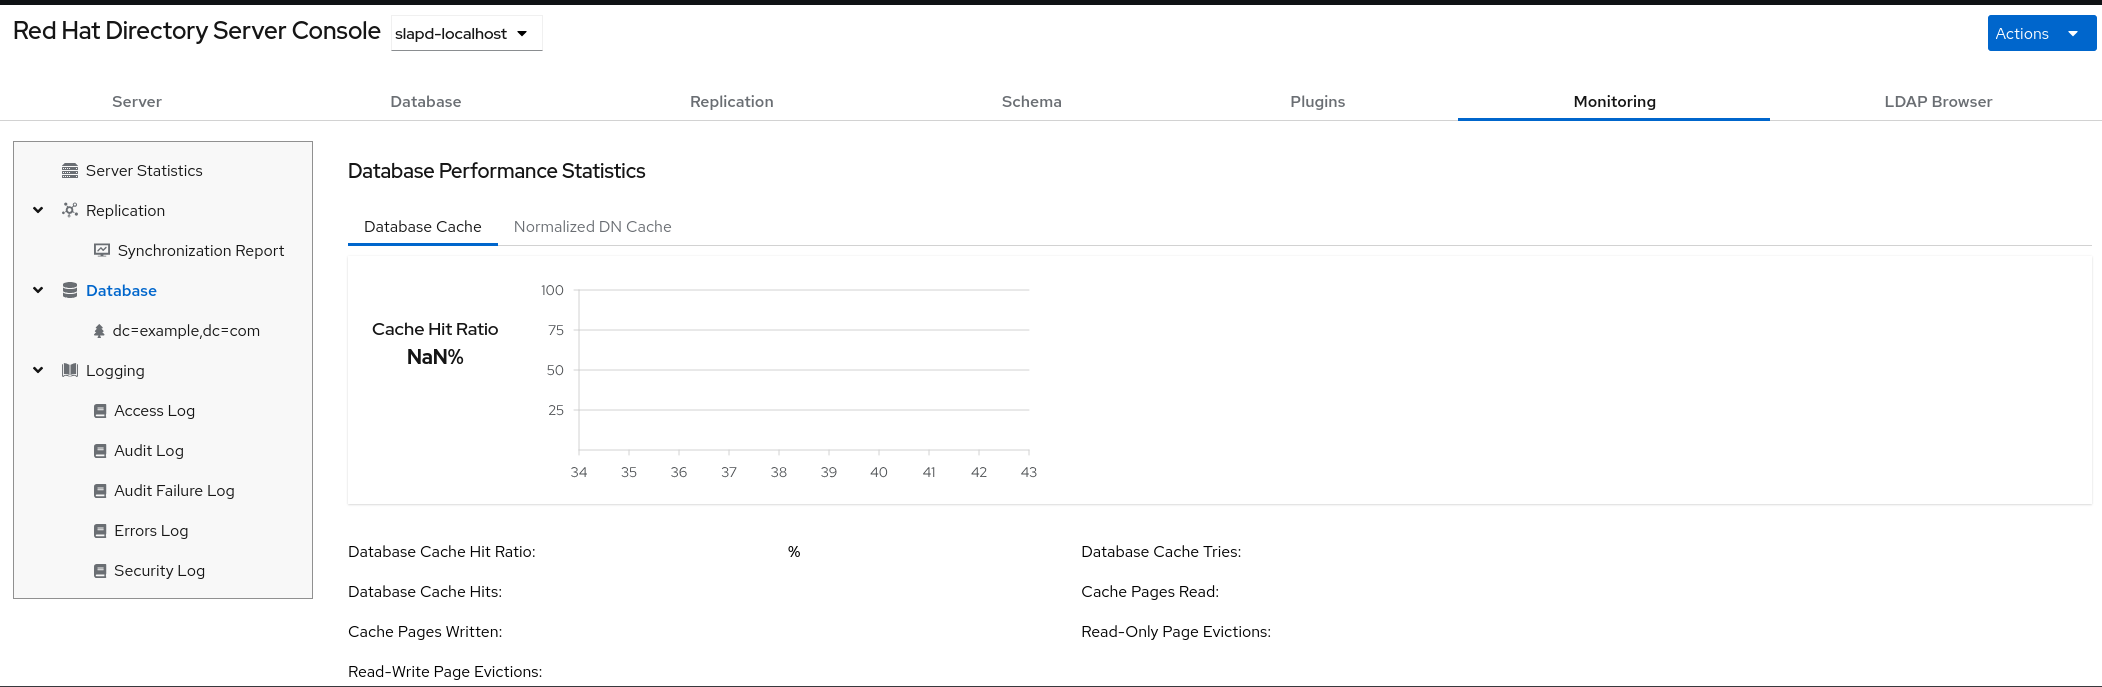
Error also when trying to display cache statistics in CLI:
# dsconf localhost monitor dbmon
Error: list index out of range

# dsconf localhost monitor backend dc=example,dc=com
dn: cn=monitor,cn=userRoot,cn=ldbm database,cn=plugins,cn=config
readonly: 0
entrycachehits: 308
entrycachetries: 323
entrycachehitratio: 95
currententrycachesize: 49691
maxentrycachesize: 512000
currententrycachecount: 14
maxentrycachecount: -1
... (total 321 lines of output)


When clicking only "Database" in Monitoring tab without going into the suffix, it shows "Cache Hit Ratio NaN%" and all the values are empty.
- links to
-
 RHBA-2025:151590
389-ds-base update
RHBA-2025:151590
389-ds-base update