-
Feature Request
-
Resolution: Done
-
 Undefined
-
None
-
None
-
None
-
None
-
False
-
-
False
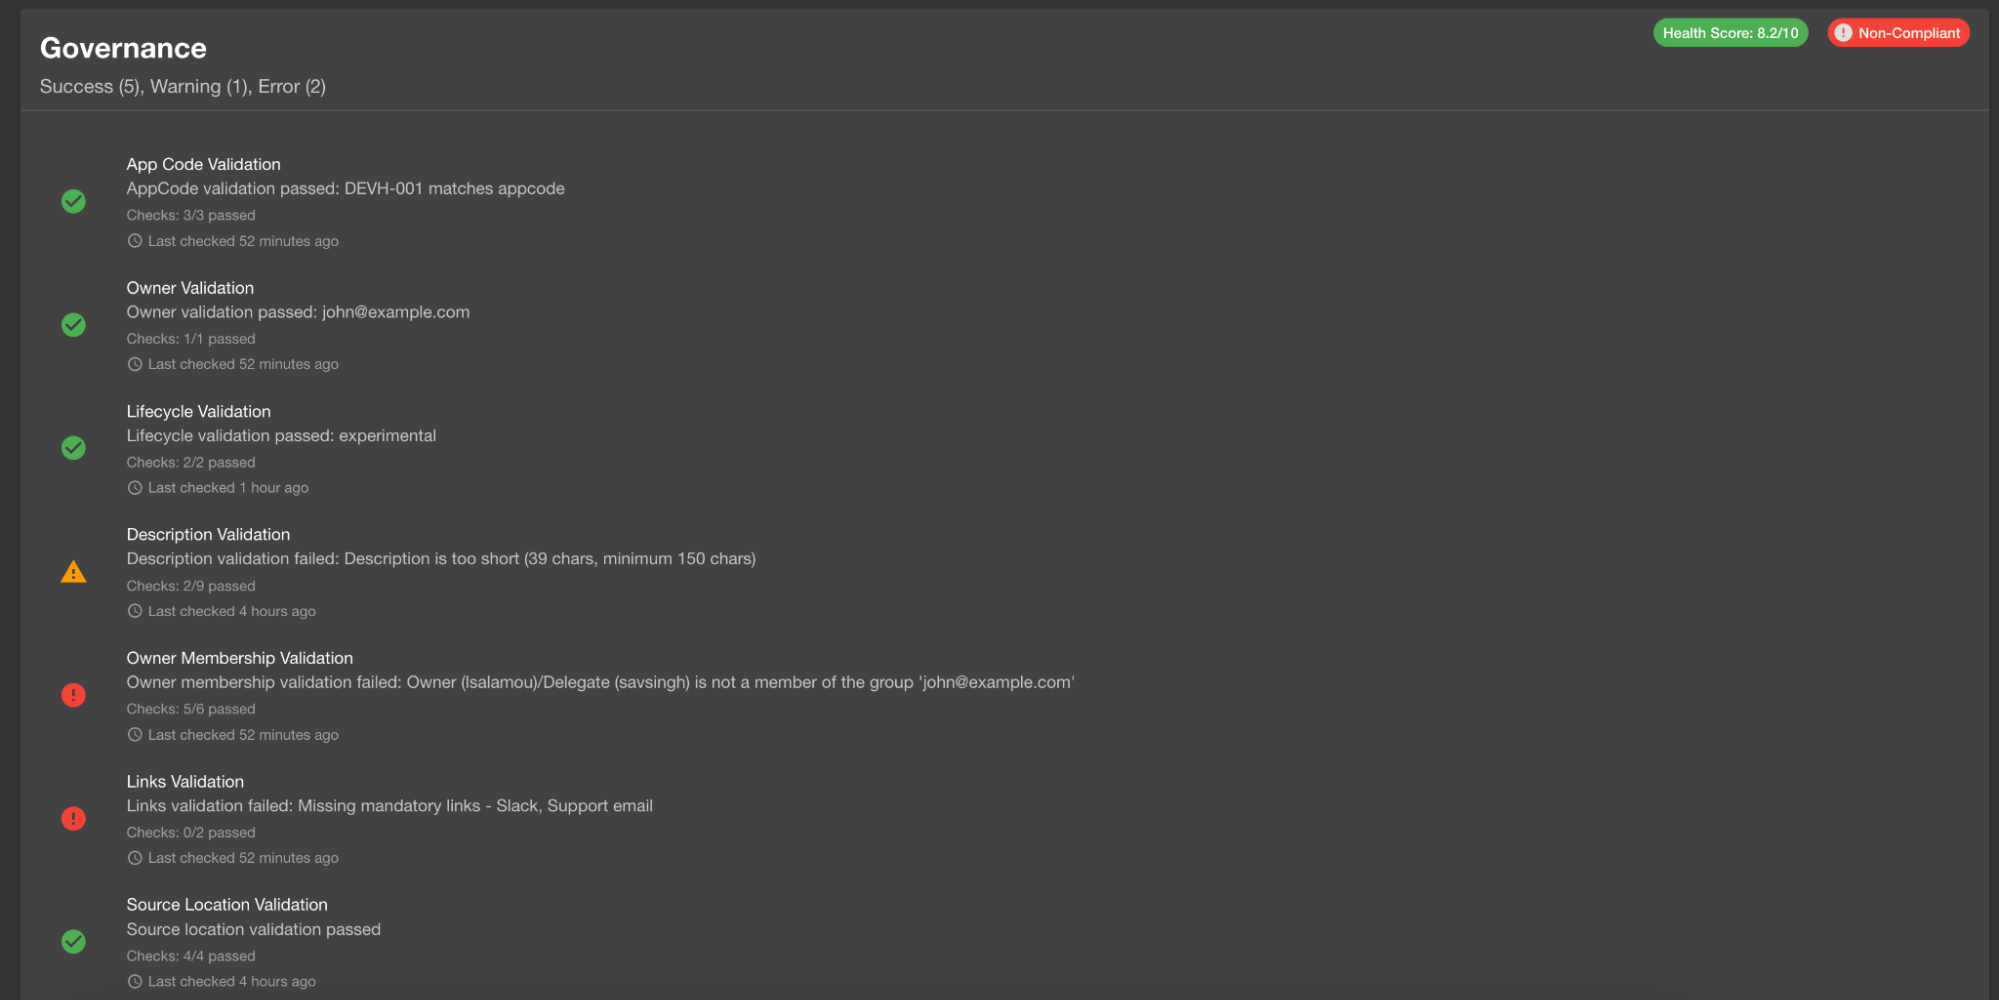
Right now, the only way to display the metrics on the entity page is by using the exported EntityScorecardContent component. This can get very confusing when we want to display multiple metrics to users, e.g., 10+. Each individual metric card takes up a lot of space, and it’s not possible to group them together by categories, such as “Compliance,” “Support,” “Security,” and so on. Also, for boolean metrics, the displayed pie chart isn’t really helpful.
It would be beneficial to implement a React component that could group multiple metrics together under one category and list them in a single UI card. We should be able to customize the card title to describe the category, set an overall description for the category, and specify which metrics will be included.
Ideally metrics would be represented in a list view without the pie charts to not clutter the UI and allow us to display more information in a condensed way.
See the attached screenshot for reference.
- is incorporated by
-
-

- New
-