-
Story
-
Resolution: Done
-
 Normal
-
None
-
None
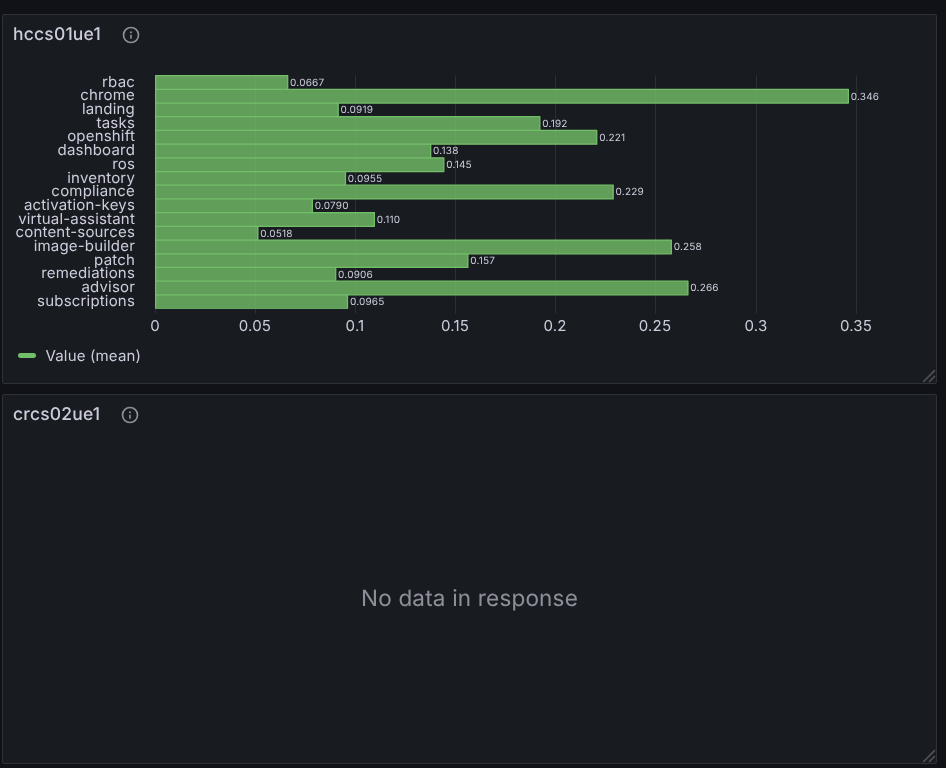
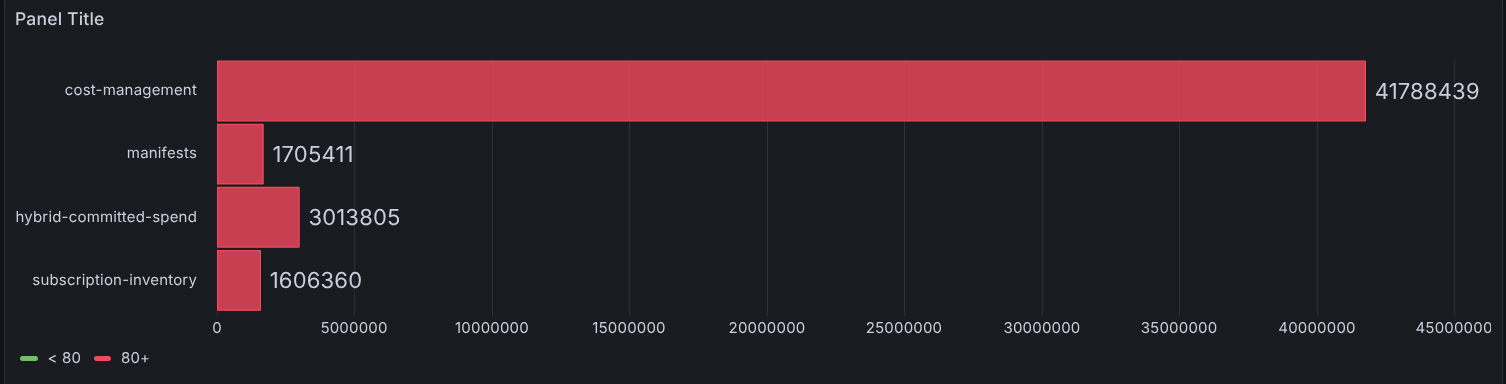
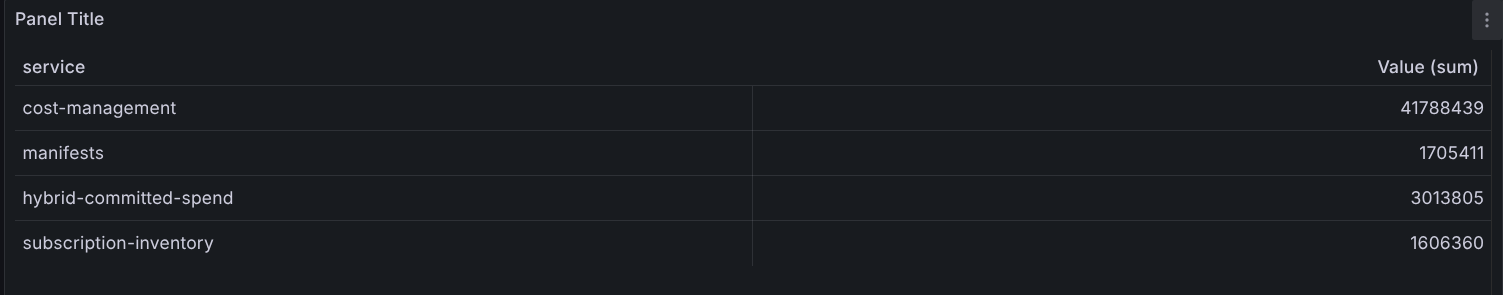
Create or configure a dashboard to monitor traffic directed to the frontends on the new cluster. The goal is to observe a shift in traffic from the old to the new cluster.
Technical details
Grafana dashboard in app-interface which pulls data from HA proxy
Helpful links
- Official instructions
https://gitlab.cee.redhat.com/service/app-interface/-/blob/master/docs/app-sre/monitoring.md#visualization-with-grafana
https://gitlab.cee.redhat.com/service/app-interface/-/blob/master/docs/app-sre/monitoring.md#updating-dashboards - Dashboard URL
https://grafana.app-sre.devshift.net/
https://grafana.stage.devshift.net/d/GSX6u0bnz/frontend-operator-metrics?orgId=1&from=now-30d&to=now&timezone=UTC&var-datasource=PDD8BE47D10408F45 - https://www.haproxy.com/documentation/haproxy-configuration-tutorials/alerts-and-monitoring/prometheus/
- depends on
-
-
- Closed
-
- mentioned on