-
Bug
-
Resolution: Done
-
 Undefined
-
ConsoleDot Q2 2020, June 2023 DevProd, DevProd June 2023 Release II, DevProd June Release Part III, DevProd June 2023 Release Part IV, DevProd June 2023 Release V, DevProd June 2023 Release VI, July 24, July 28th Dev Prod, July 28th Dev Prod- Round 2, Aug Release , Aug Release #2, Aug #3, Aug #4, DevProd Release Completed Items (August 15, 2023), Release-Aug, Aug #2
-
None
-
False
-
-
False
-
None
-
Unset
-
No
-
-
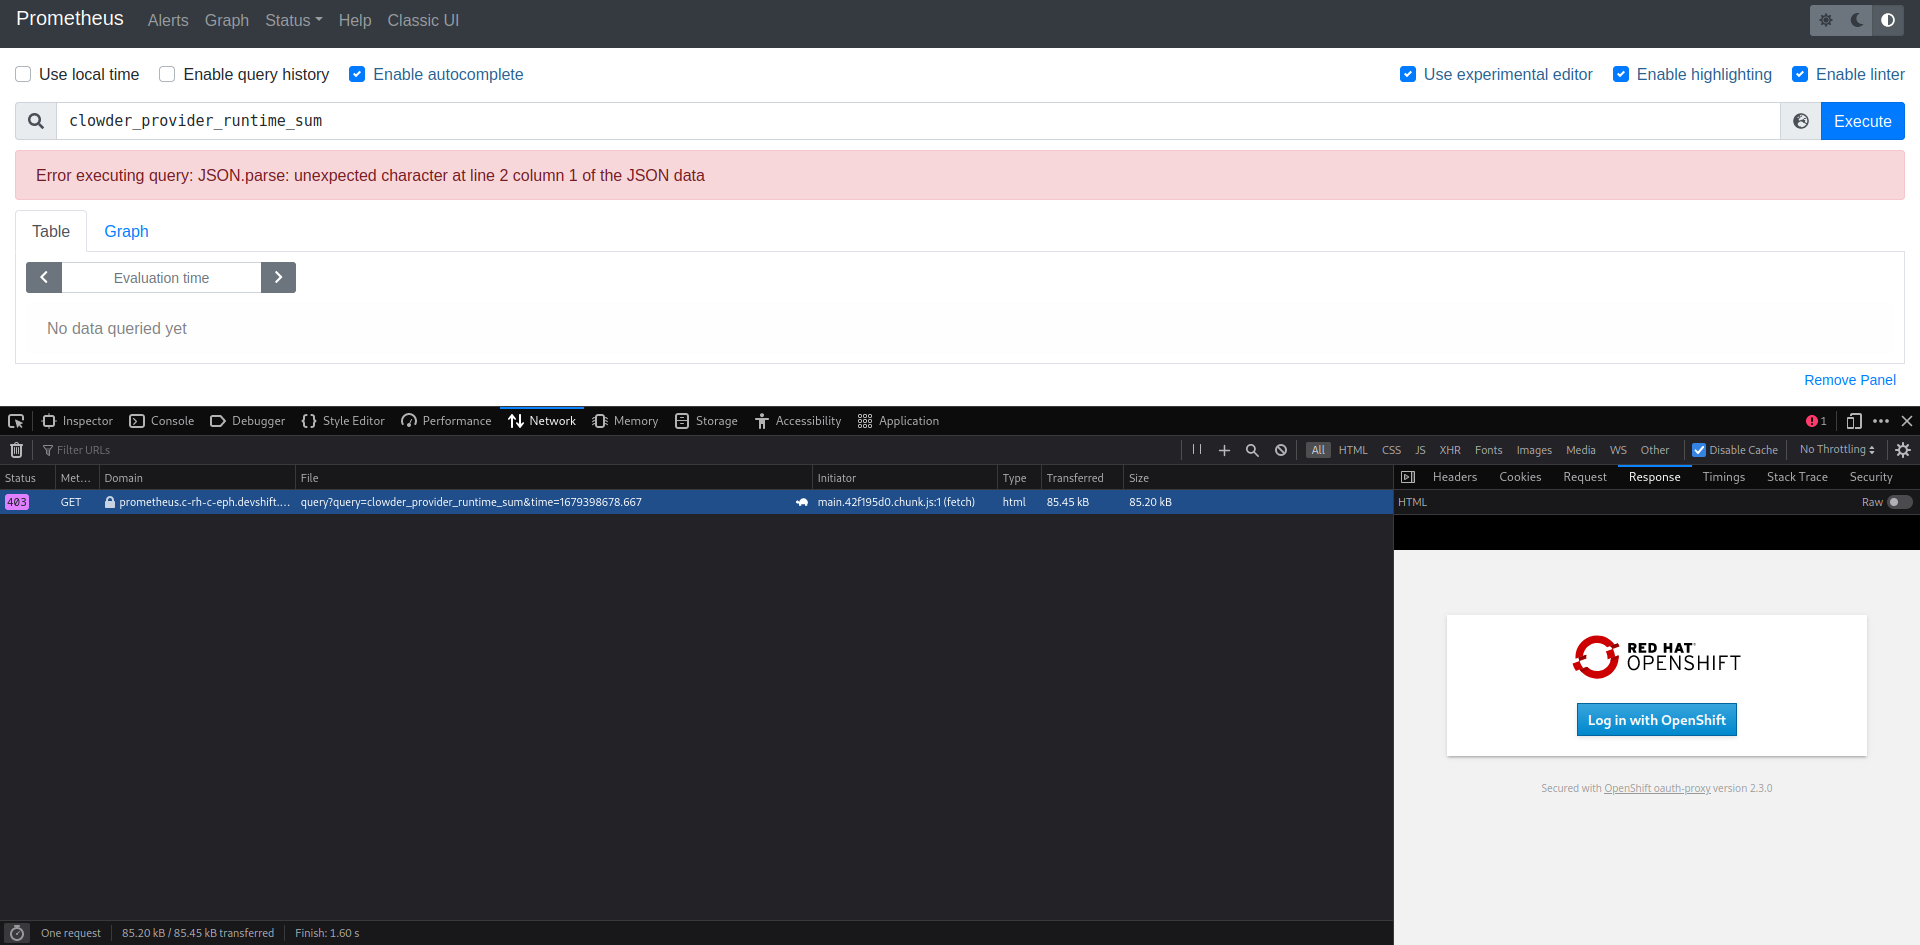
The grafana dashboards are not stable right now, refreshing the page often yields blank metric panels with no data, but they still get a 200 response from the prometheus server.