-
Feature Request
-
Resolution: Done
-
 Normal
-
None
-
openshift-4.18
-
None
-
None
-
Future Sustainability
-
None
-
False
-
-
None
-
None
-
None
-
-
None
-
None
-
None
-
None
-
None
We are managing OpenShift clusters with more than 30 nodes. If Prometheus generates a separate alert for each node, the Observe -> Alerting panel is flooded with alerts. Example of an alert rule that generates such alerts is SystemMemoryExceedsReservation.
There are other alert rules that can flood the Alert panel, too. For example, if a single node in the cluster is down, we get a lot of KubeDaemonSetRolloutStuck alerts. One for each DaemonSet deployed in the cluster.
When the Alert panel is flooded with "duplicate" alerts, it's difficult to spot the alert that come as a single alert somewhere in between.
The "duplicate" alerts are typically resolved together by for example configuring the system memory reservations.
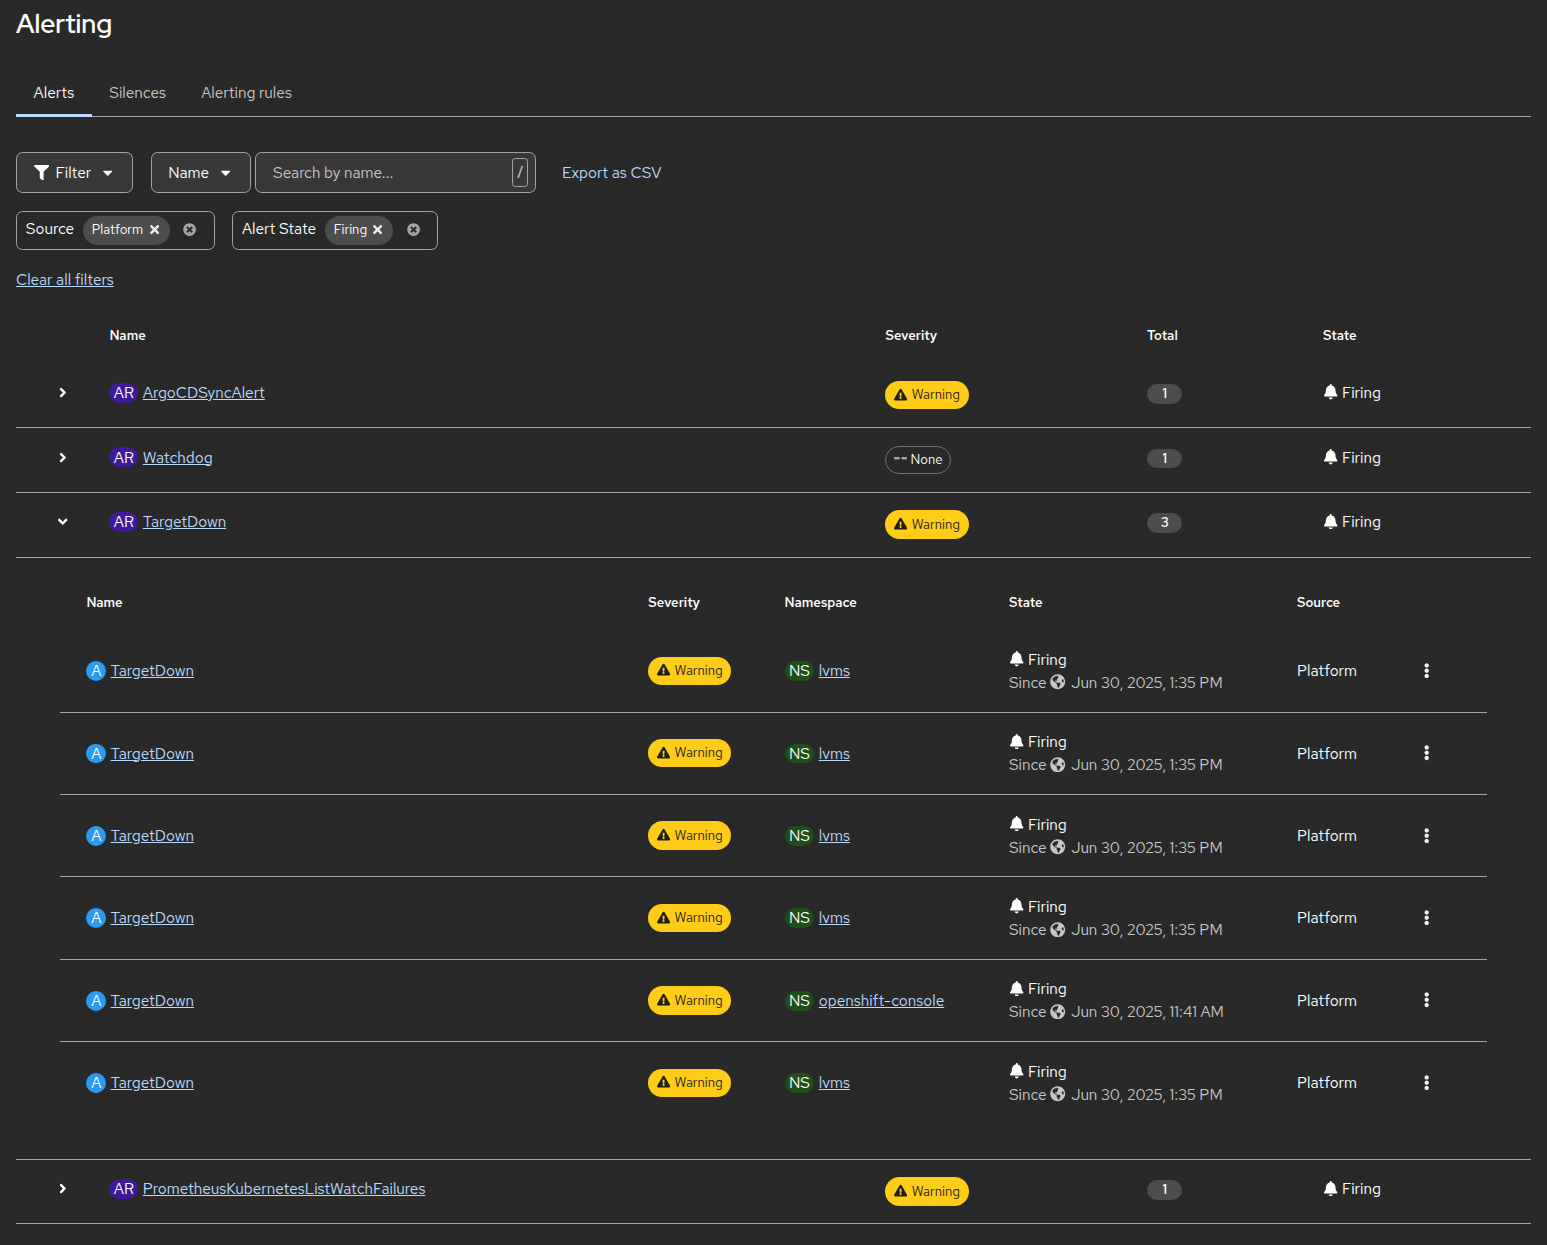
Would it be possible to collapse the firing alerts by their Name and Severity? When collapsed, the count of collapsed alerts should be displayed in the collapsed row. User can click on the collapsed row to unfold all the collapsed alerts.
