-
Feature Request
-
Resolution: Unresolved
-
 Normal
-
None
-
None
-
False
-
None
-
False
-
Not Selected
-
-
-
-
1. Proposed title of this feature request
Display storage average latency in the OpenShift dashboard
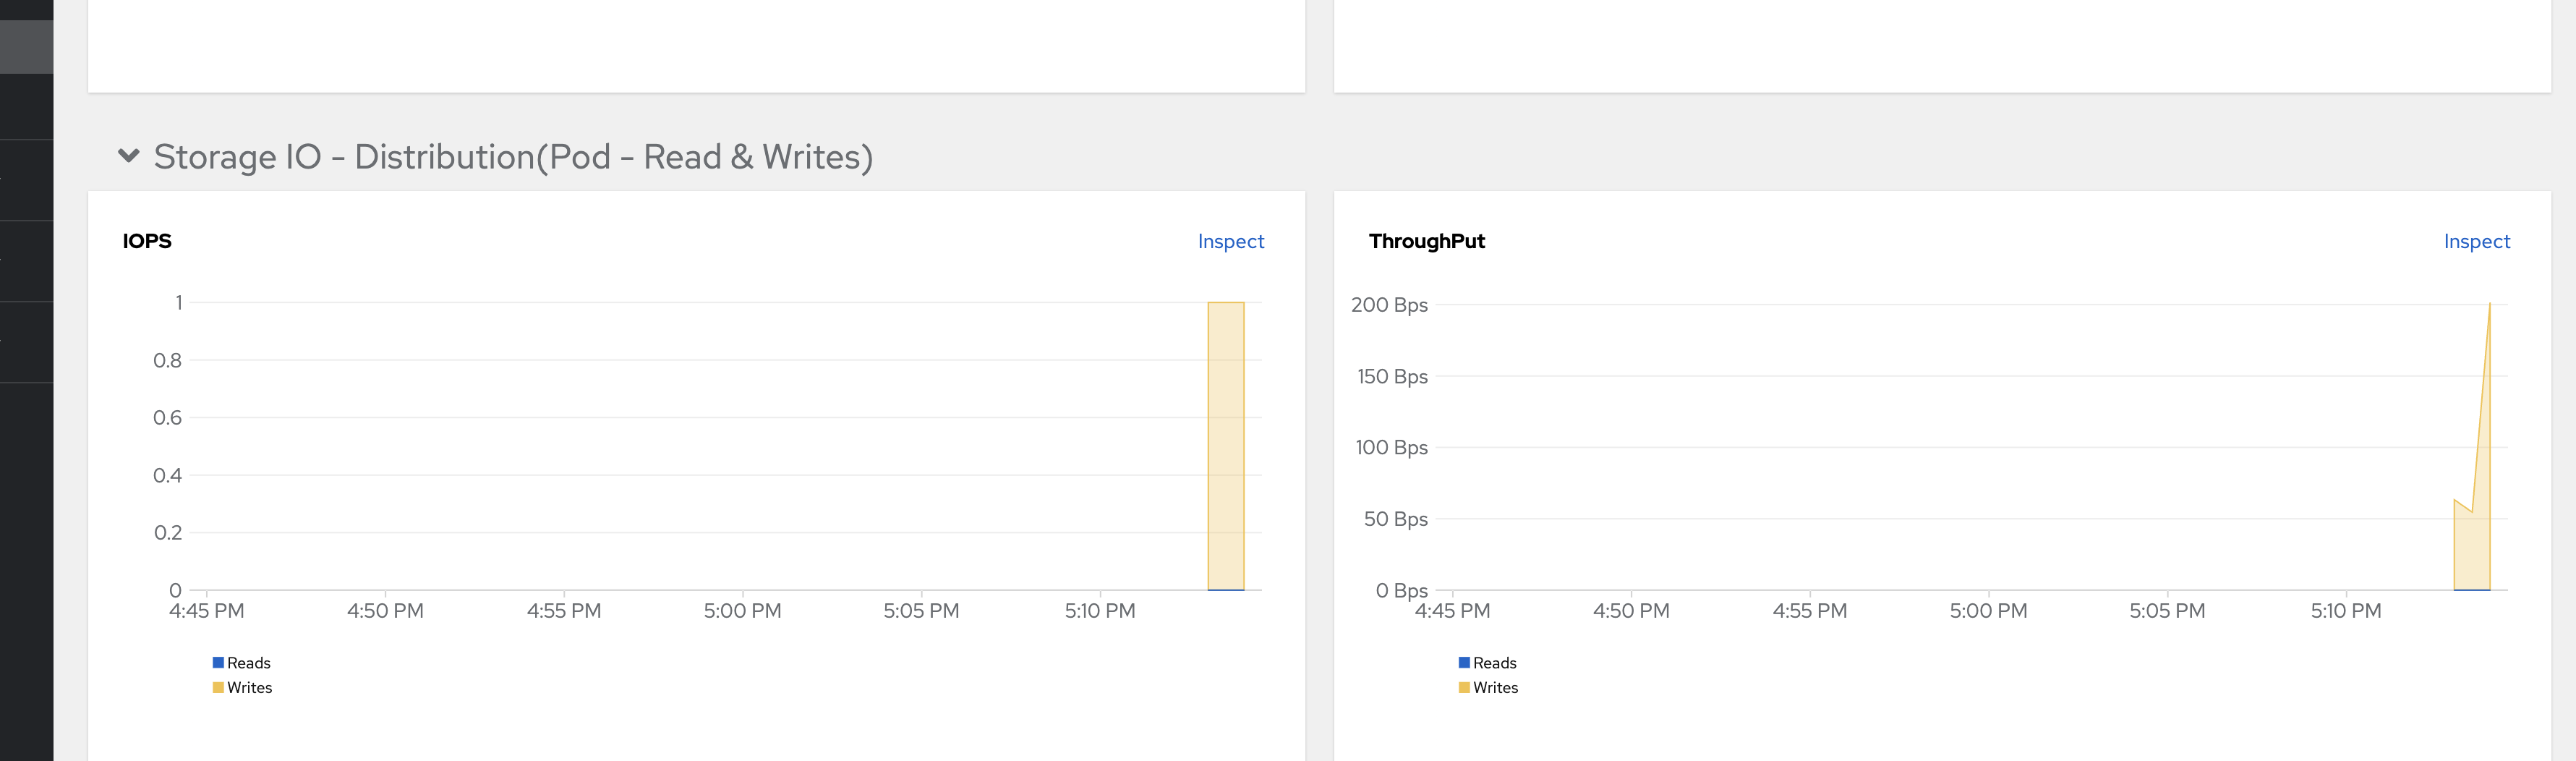
2. What is the nature and description of the request? Currently, in the
OpenShift dashboard (Administrator role → Observe → Dashboards), storage metrics such as IOPS and Throughput can be viewed in the Kubernetes / Compute Resources / Namespaces (Pods) dashboard. Customer is proposing to enhance this dashboard by incorporating a section that displays the average latency of I/O operations. Understanding the performance of the storage backend in OpenShift is crucial. Specifically, we suggest including:
-Average latency.
-99% Average latency.
-95% Average latency.
These are standard metrics found in every container and virtualization system (for example, VMware). It is of utmost importance from the OpenShift administrator's perspective to have visibility into the average latency of I/O operations.
3. Why it is needed? (List the business requirements here)
Presently, the OpenShift dashboard lacks visibility into the performance of the underlying storage backend. While the dashboard includes metrics for IOPS and throughput, crucial information about latency is conspicuously absent. Latency is a pivotal metric for gauging whether applications are encountering any issues during data operations.
4. List any affected packages or components.
In the OpenShift dashboard, incorporating a section on storage latency metrics is crucial. I presume these metrics are already available in Prometheus. If not, we should ensure their inclusion for display in the Kubernetes / Compute Resources / Namespaces (Pods) dashboard.