-
Feature Request
-
Resolution: Unresolved
-
Major
-
None
-
None
-
None
-
Product / Portfolio Work
-
None
-
False
-
None
-
None
-
None
-
-
-
None
-
-
None
-
None
-
None
1. Proposed title of this feature request
Show node-role.kubernetes.io in Motoring Dashboard to easily identify nodes by role
2. What is the nature and description of the request?
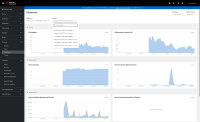
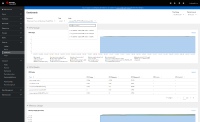
In Monitoring Dashboards such as /monitoring/dashboards/grafana-dashboard-k8s-resources-node, /monitoring/dashboards/grafana-dashboard-node-cluster-rsrc-use and /monitoring/dashboards/grafana-dashboard-node-rsrc-use it would helpful to add node-role.kubernetes.io to the OpenShift - Node selection and view to easily understand what role the OpenShift - Node has.
Especially in Cloud environments, it's hard to keep OpenShift - Node(s) separated and understand what the respective OpenShift - Node is doing. Showing the node-role.kubernetes.io could help here as it would allow to separate between important OpenShift - Nodes, such as Control-Plane Node, Infra or simple worker Node.
Including in addition for https://kubernetes.io/docs/reference/labels-annotations-taints/#failure-domainbetakubernetesiozone to select the different available Availability Zones (if available) would be great too, to potentially look at the data for a specific node role in a specific availability zone.
3. Why does the customer need this? (List the business requirements here)
For troubleshooting purpose and observability reason, it's often required to switch between CLI and console to understand what node-role and availability zone Administrator want to review. Having this all integrated in the Web-UI will improve observability and allow better filtering when looking into specific nodes, availability zones, etc.
4. List any affected packages or components.
OpenShift - Management Console
- is cloned by
-
OBSDA-201 Show node-role.kubernetes.io in Monitoring Dashboard to easily identify nodes by role
-
- In Progress
-

