Uploaded image for project: 'Performance and Scale for AI Platforms'
  1. Performance and Scale for AI Platforms
  2. PSAP-1478

Visualize Embedding Results via Grafana

XMLWordPrintable

    • Icon: Story Story
    • Resolution: Done
    • Icon: Normal Normal
    • None
    • None
    • RHOAI
    • None
    • PSAP - General-8, PSAP - General-10

      User Story:
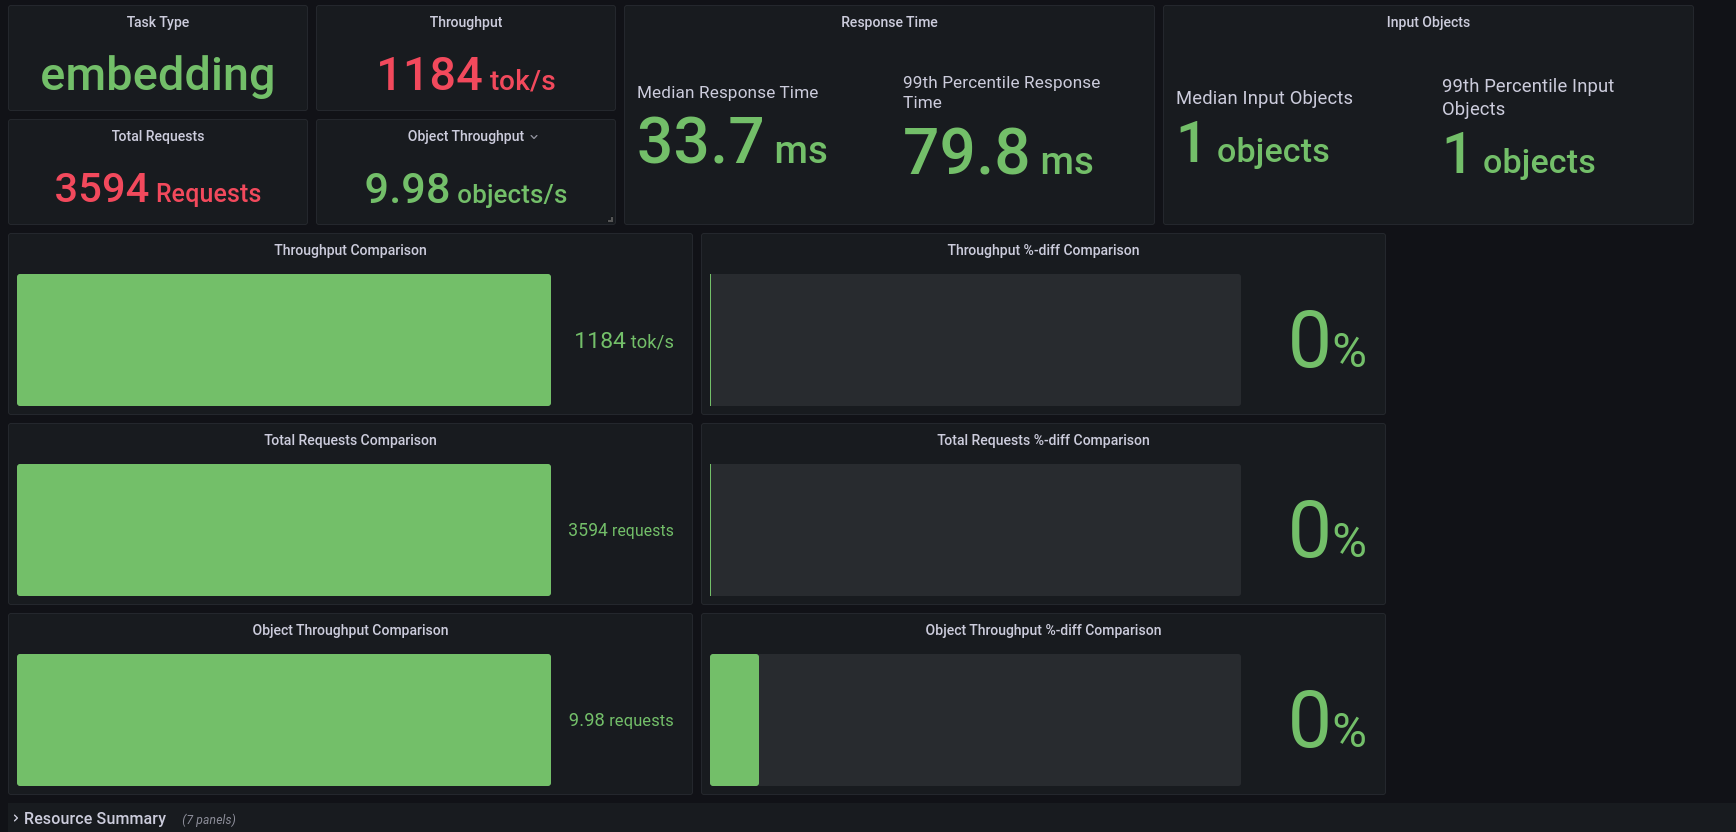
      As a PSAP engineering I want to be able to quickly compare results from our embedding testing. Kube-burner automatically can index usage metrics into OpenSearch, so we want a dashboard in Grafana that can visualize both the surrounding usage metrics and the KPI's from our embedding llm-load-test.

      Acceptance criteria:

      • A Grafana dashboard that contains both system usage metrics (including GPU) and llm-load-test KPI's

            rh-ee-dripberg Drew Ripberger
            rh-ee-dripberg Drew Ripberger
            Votes:
            0 Vote for this issue
            Watchers:
            1 Start watching this issue

              Created:
              Updated:
              Resolved:

                Estimated:
                Original Estimate - 2 minutes
                2m
                Remaining:
                Remaining Estimate - 2 minutes
                2m
                Logged:
                Time Spent - Not Specified
                Not Specified