-
Story
-
Resolution: Done
-
 Undefined
-
None
-
False
-
False
-
Undefined
-
-
Console UXD Sprint 200, Console UXD Sprint 201, OpenShift UXD Sprint 202
Background
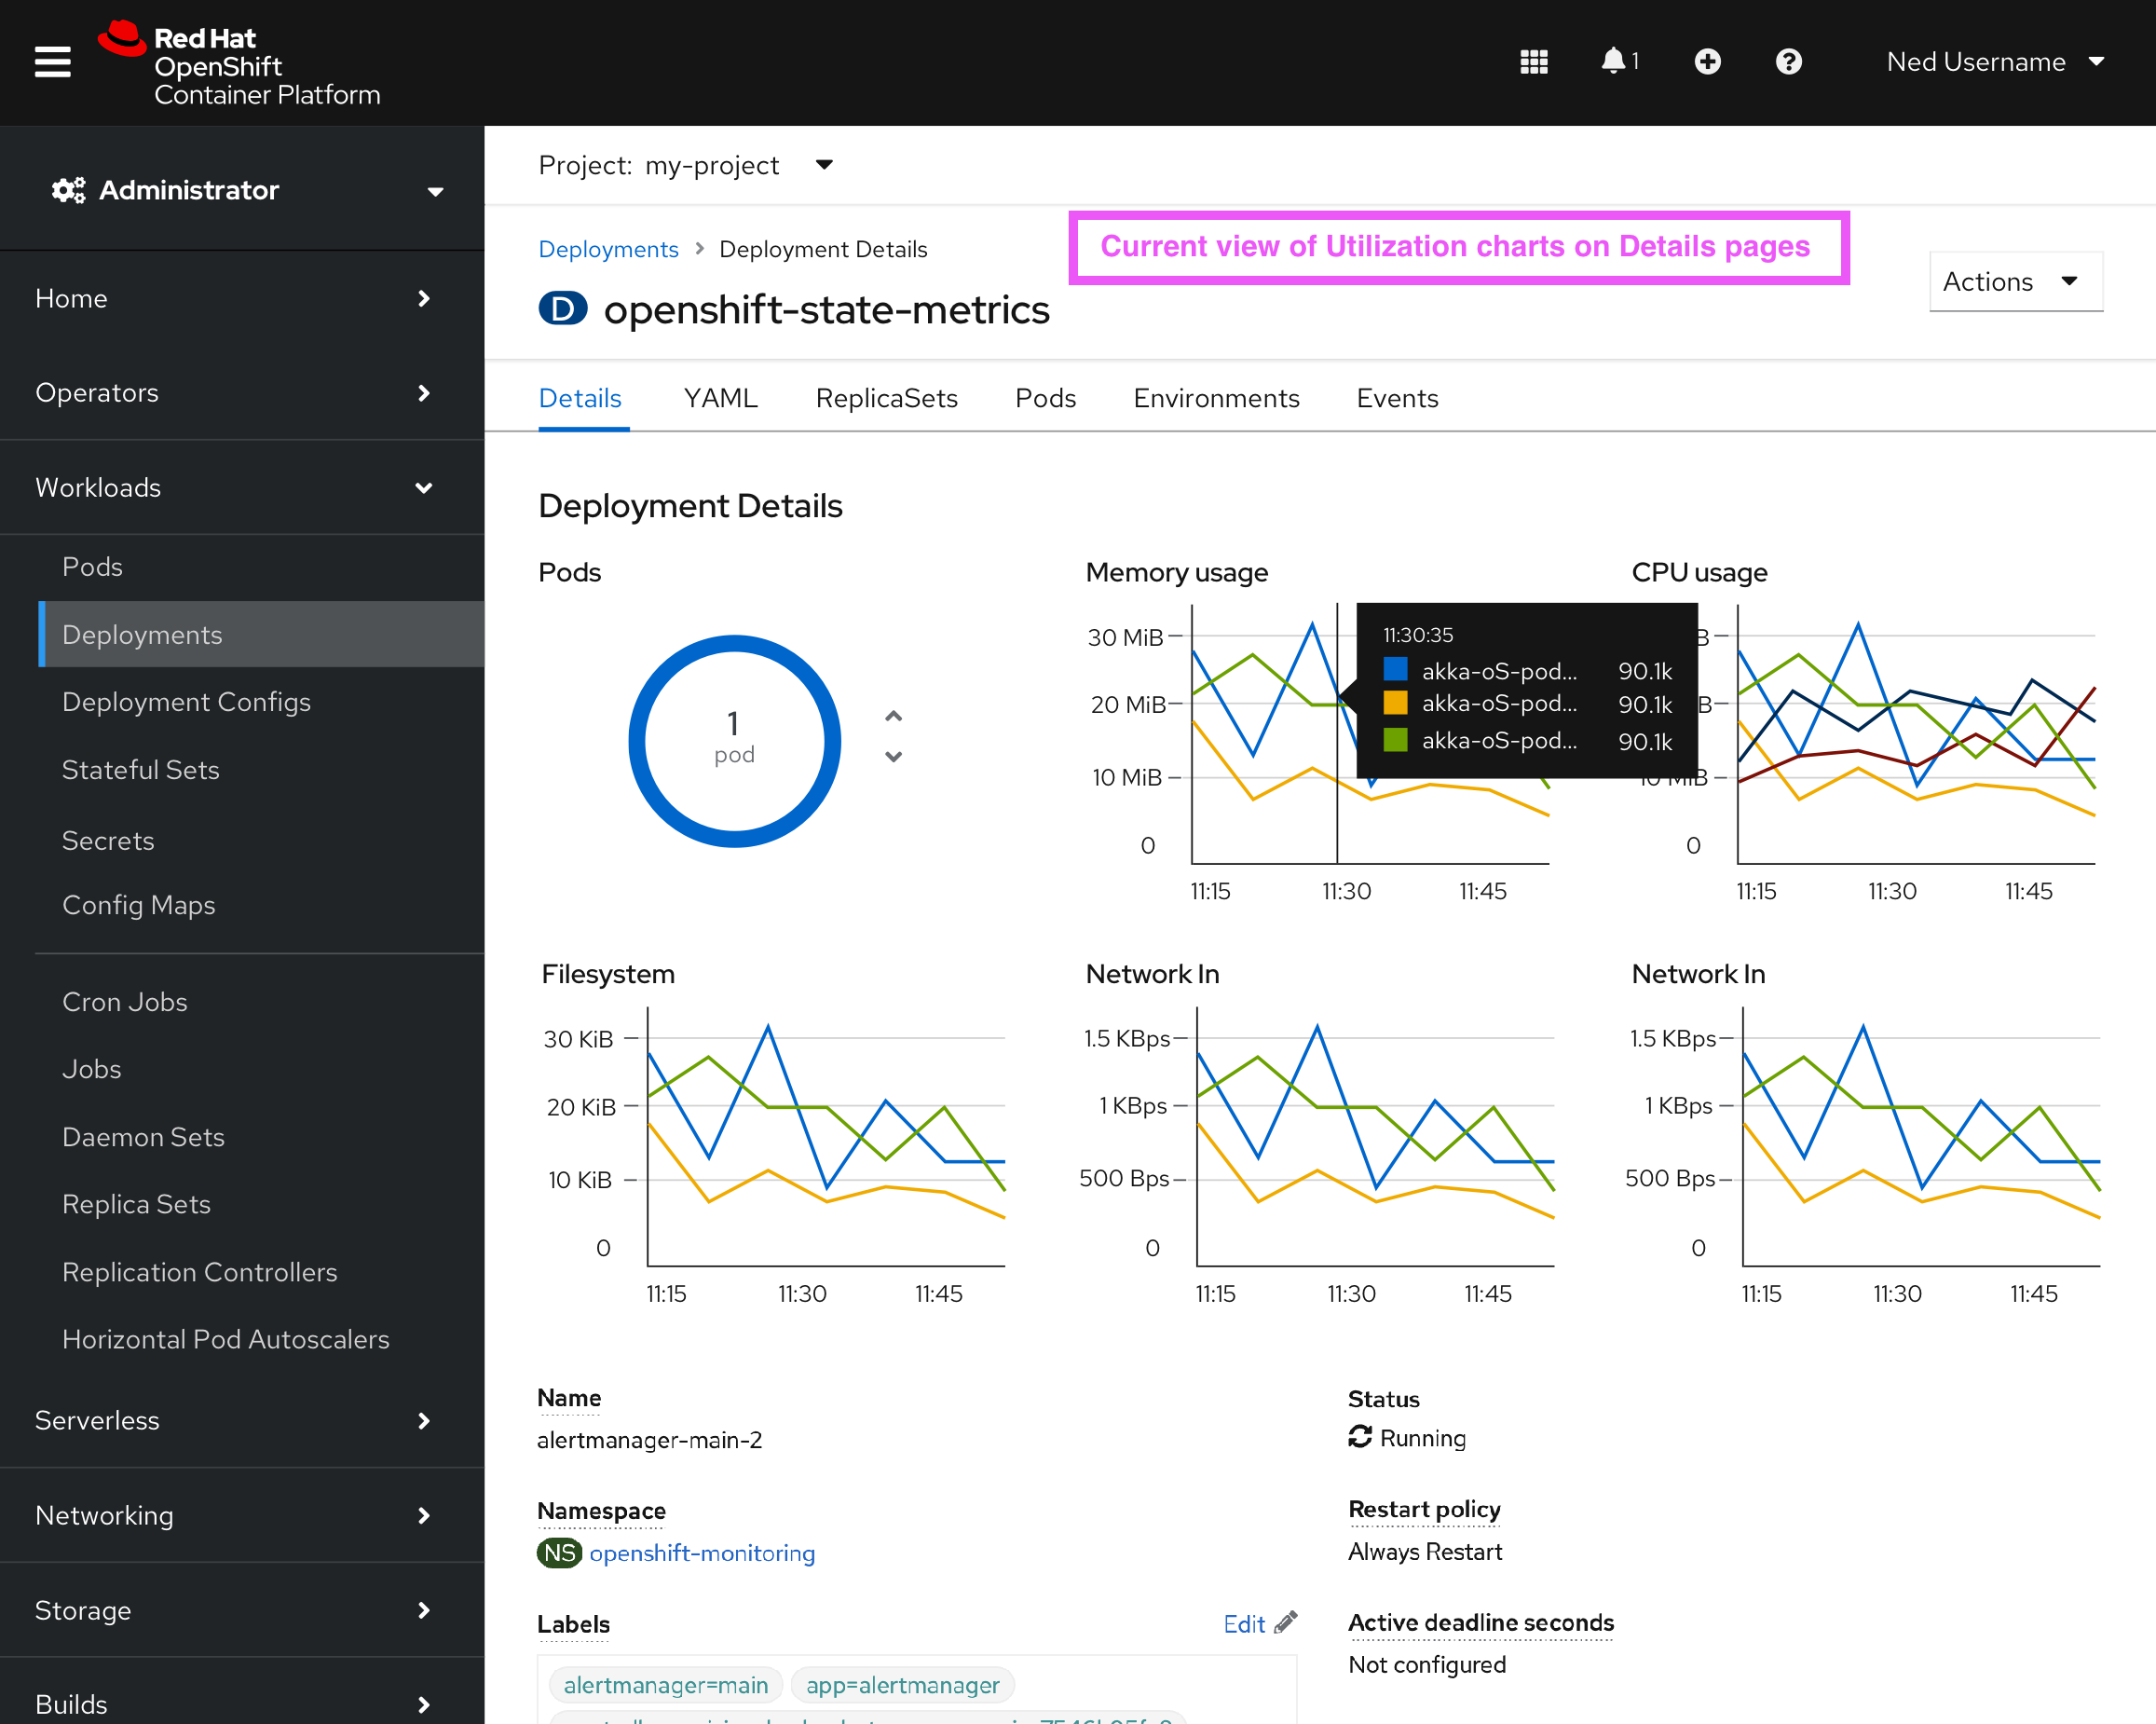
Utilization charts are being added to the Details pages of following Workloads areas:
Deployments, ReplicaSets, DeploymentConfig, StatefulSets, CronJobs, etc.
These charts are being surfaced in a small three column layout that makes it difficult to read the data on Deployments with many Pods.
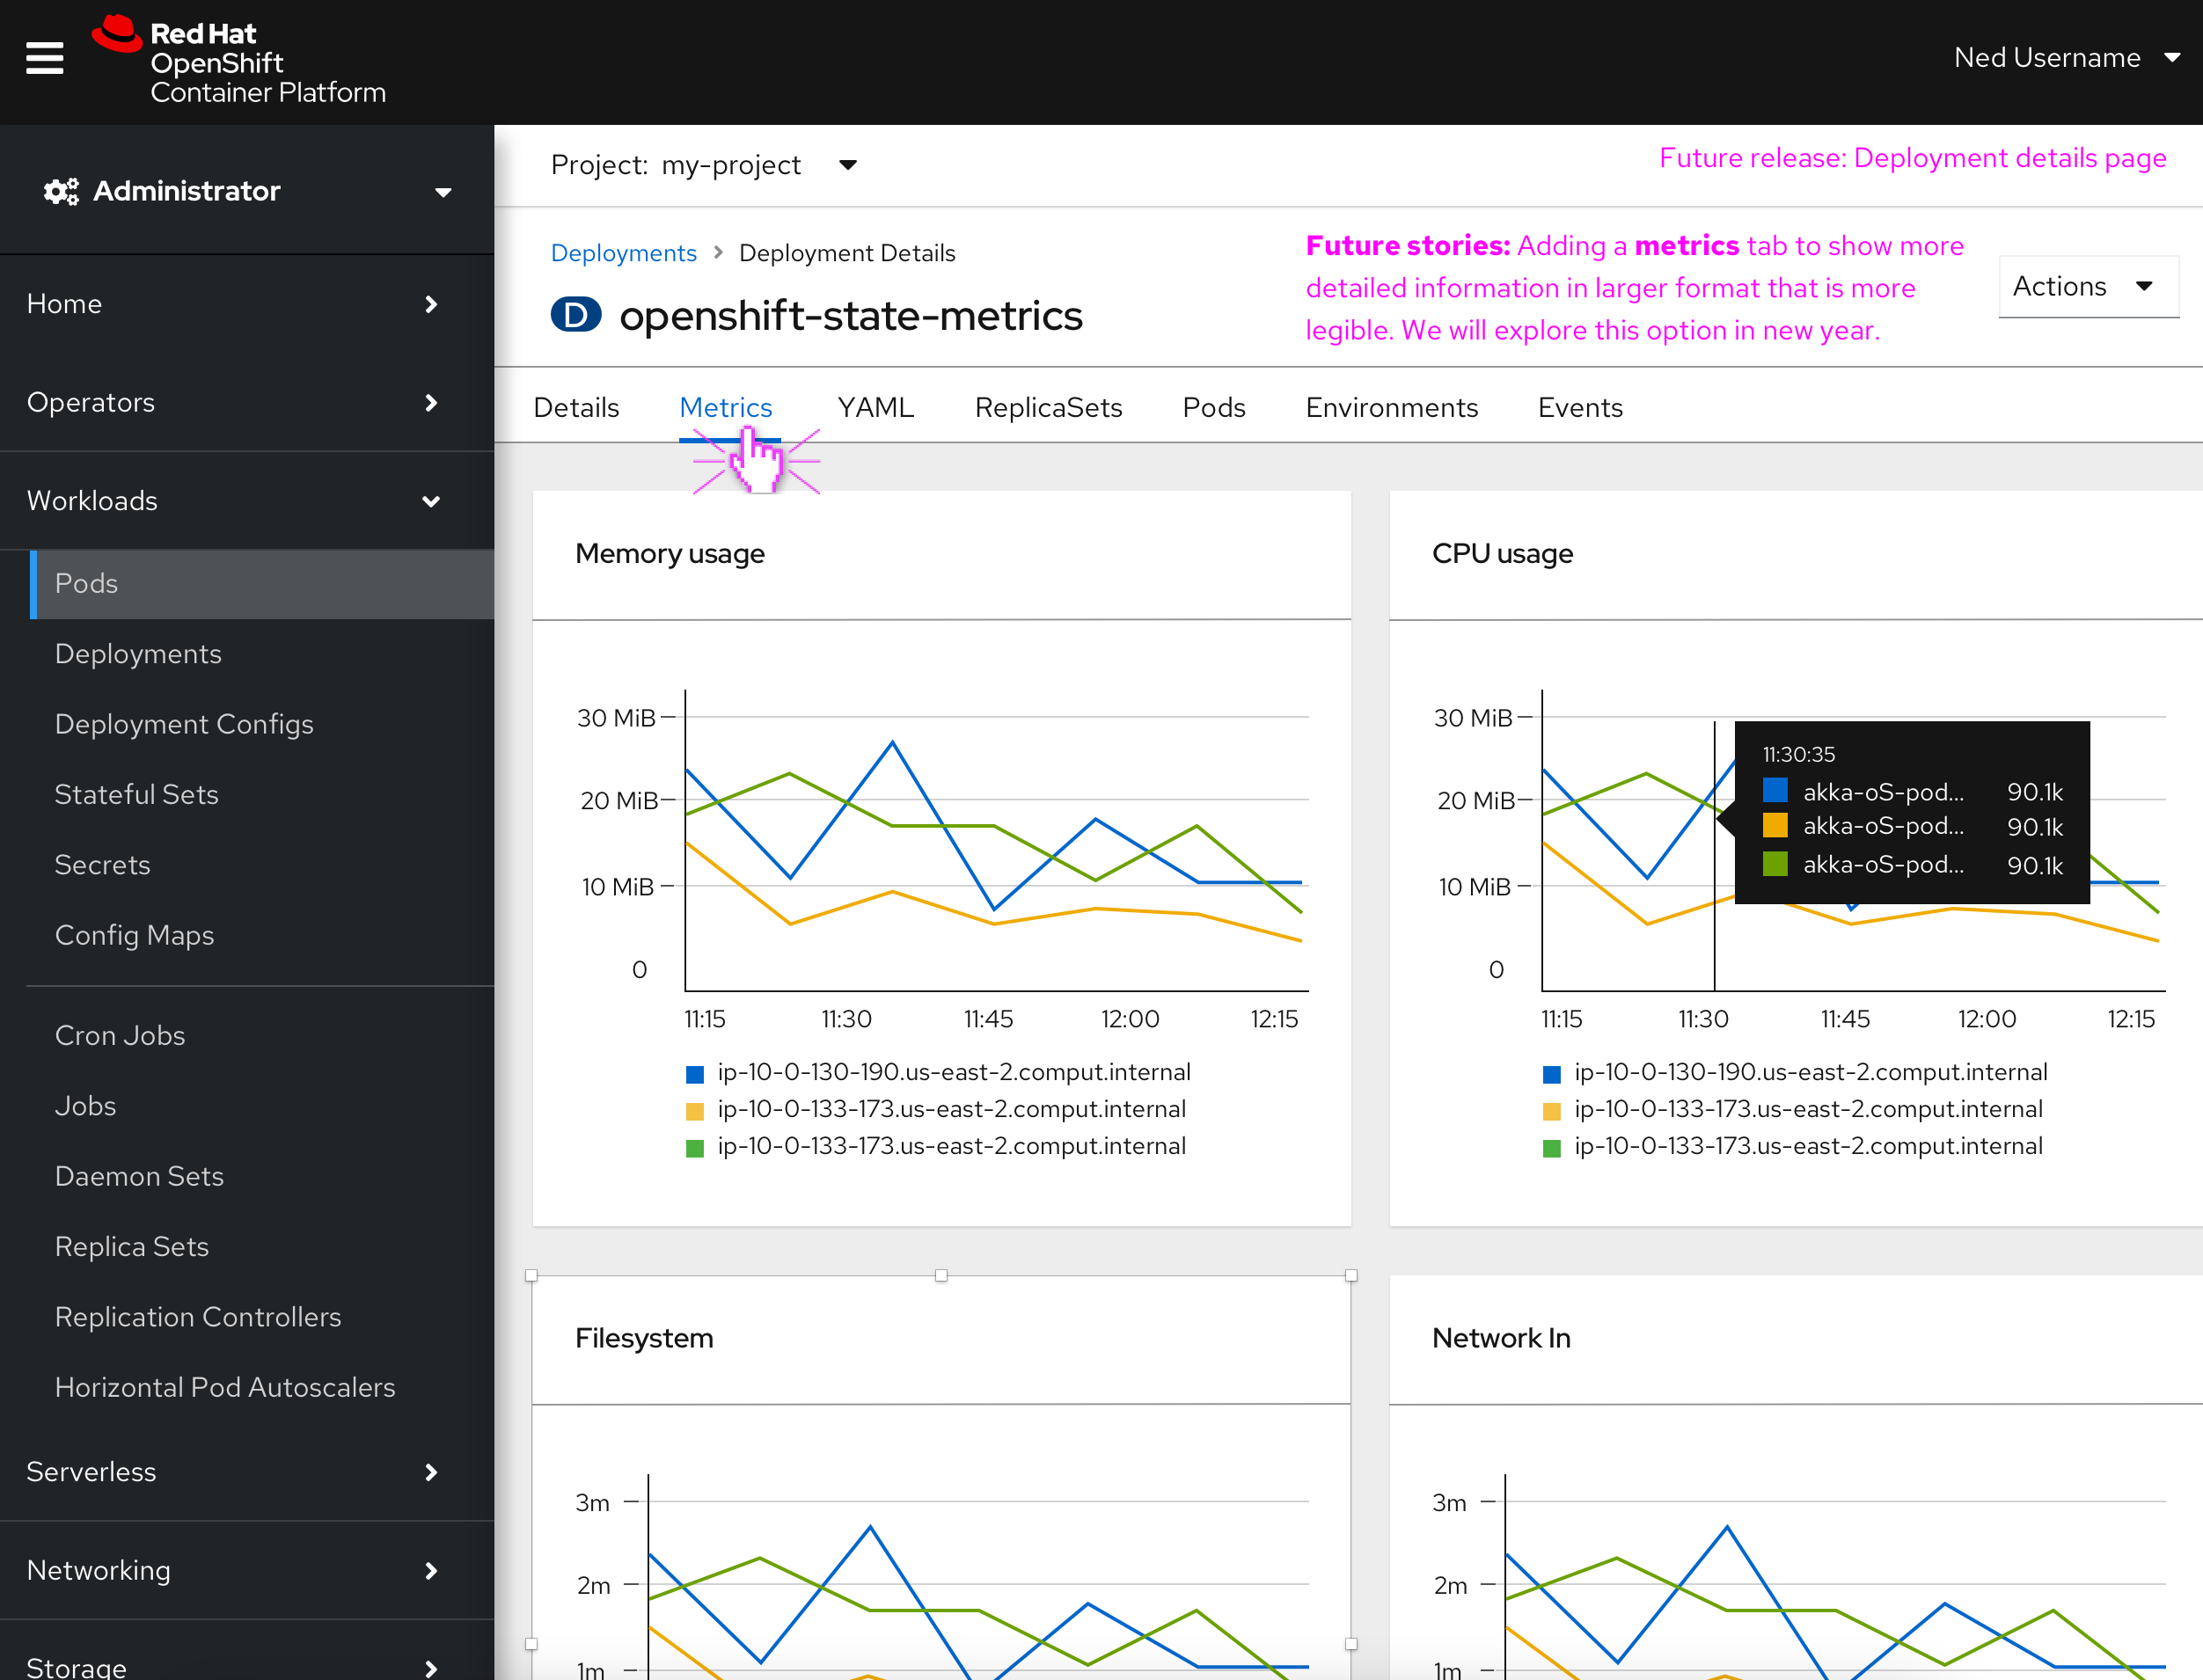
Goal
Creating a Metrics tab where Utilization charts can be viewed at larger scale with clickable Legends that allow user to filter pods. Moving these charts out of main area of the Details view will allow more space for HPA work being done in this space.
*Need to consider the Reporting function through Prometheus. *
- is related to
-
-

- Closed
-
-
-

- Closed
-