-
Bug
-
Resolution: Done
-
 Normal
-
None
-
None
-
None
-
Quality / Stability / Reliability
-
False
-
-
None
-
Moderate
-
None
-
None
-
Sprint 273
-
None
-
None
-
None
Pre-req:
- Install COO1.2.0 from OperatorHub just to have COO installed
- Patch COO CSV with monitoring-console-plugin image generated from this PR that contains the fix for #OU-814 https://github.com/openshift/monitoring-plugin/pull/448 (quay.io/rh-ee-emurasak/monitoring-console-plugin:ou814v04 or ou814v05)
- On COO, install these PersesDashboard in perses-dev namespace
-
- https://github.com/etmurasaki/dotfiles/blob/main/scripts/rbac/dashboards/perses-dashboard-sample.yaml
- https://github.com/etmurasaki/dotfiles/blob/main/scripts/rbac/dashboards/prometheus-overview-variables.yaml
- https://github.com/etmurasaki/dotfiles/blob/main/scripts/rbac/dashboards/openshift-cluster-sample-dashboard.yaml
- https://github.com/etmurasaki/dotfiles/blob/main/scripts/rbac/dashboards/thanos-compact-overview-1var.yaml
- create this datasource
- https://github.com/etmurasaki/dotfiles/blob/main/scripts/rbac/dashboards/thanos-querier-datasource.yaml
-
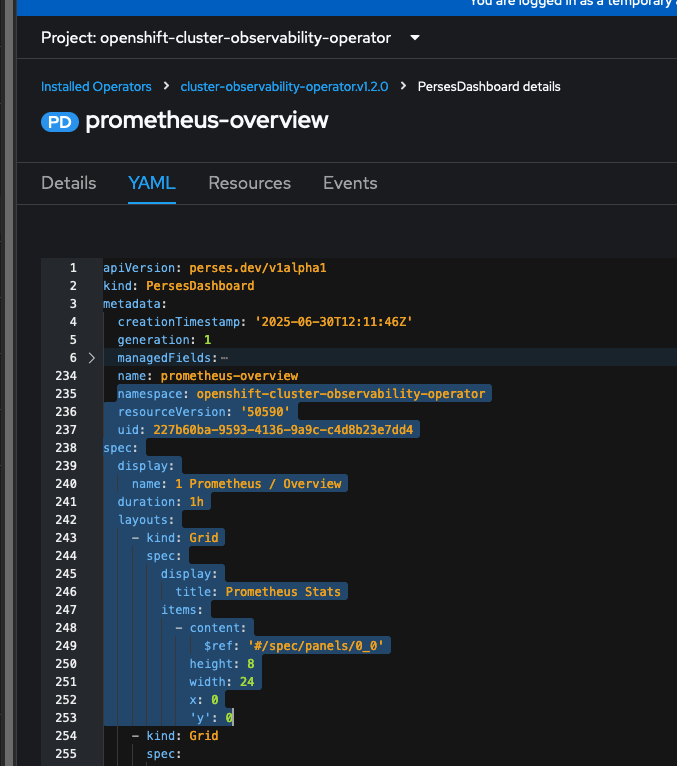
- Install this PersesDashboard in openshift-cluster-observability-operator:
- https://github.com/etmurasaki/dotfiles/blob/main/scripts/rbac/dashboards/prometheus-overview-variables.yaml with the spec.display.name including 1 Prometheus / Overview just to differentiate from the other namespace
Steps:
- Log into ocp
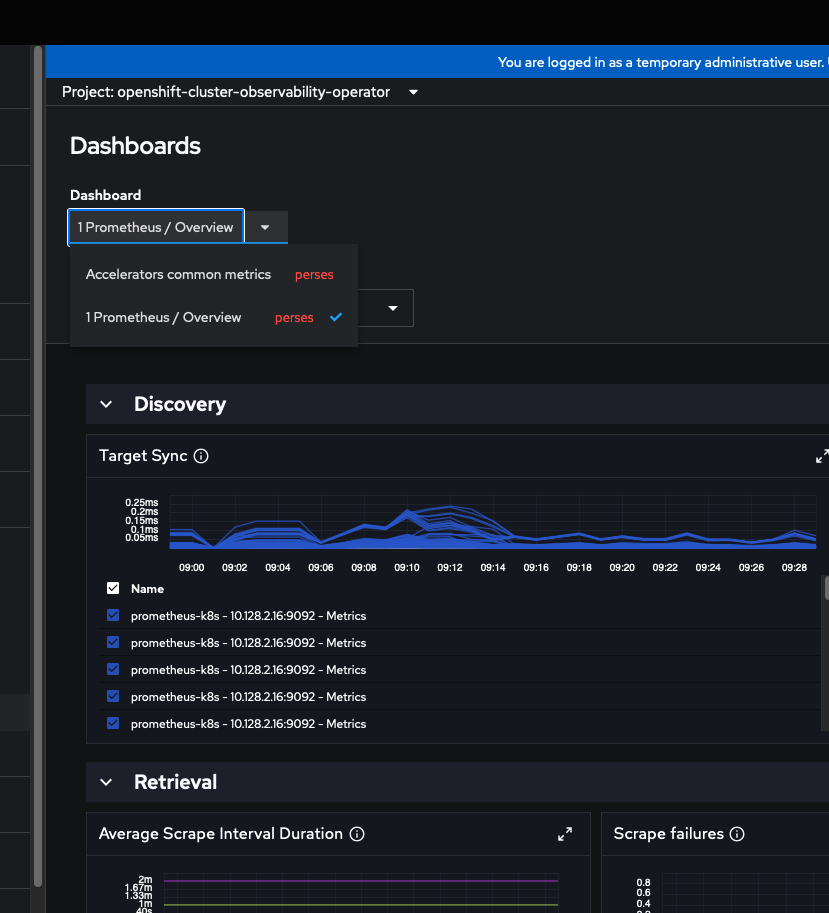
- Go To Observe > Dashboards (Perses)
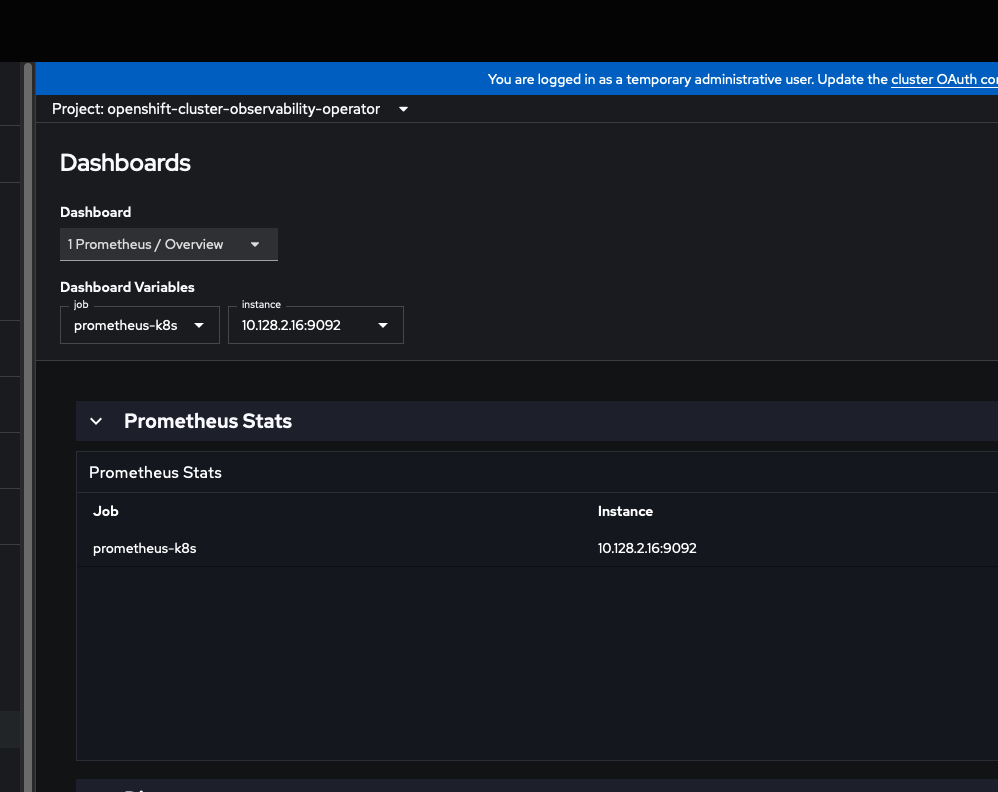
- Select 1 Prometheus / Overview dashboard
- Switch to Perses-dev project
- Notice that the first time, Prometheus / Overview dashboard is "loaded"
- Click on Dashboard dropdown: notice that Prometheus / Overview dashboard is the third in alphabetical order
- Switch back to openshift-cluster-observability-operator project
- Notice only the Dashboard dropdown is updated with 1 Prometheus / Overview, but the whole page is the same
Note: When testing with the same dashboard name but different layout it causes problems, because the content is not reloaded correctly. See video attached.
- Go To COO
- PersesDashboards tab
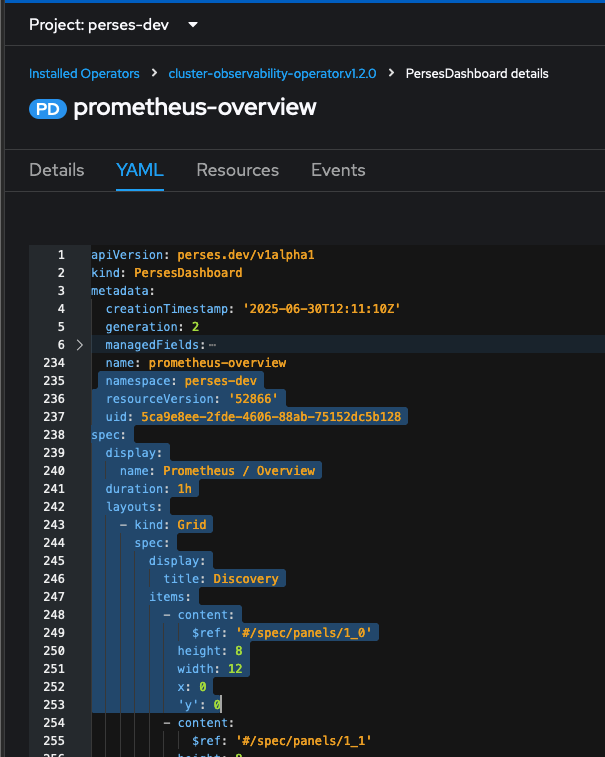
- Edit prometheus-overview for perses-dev namespace
- Under spec.layouts, remove the first Grid containing Prometheus Stats
- Save it
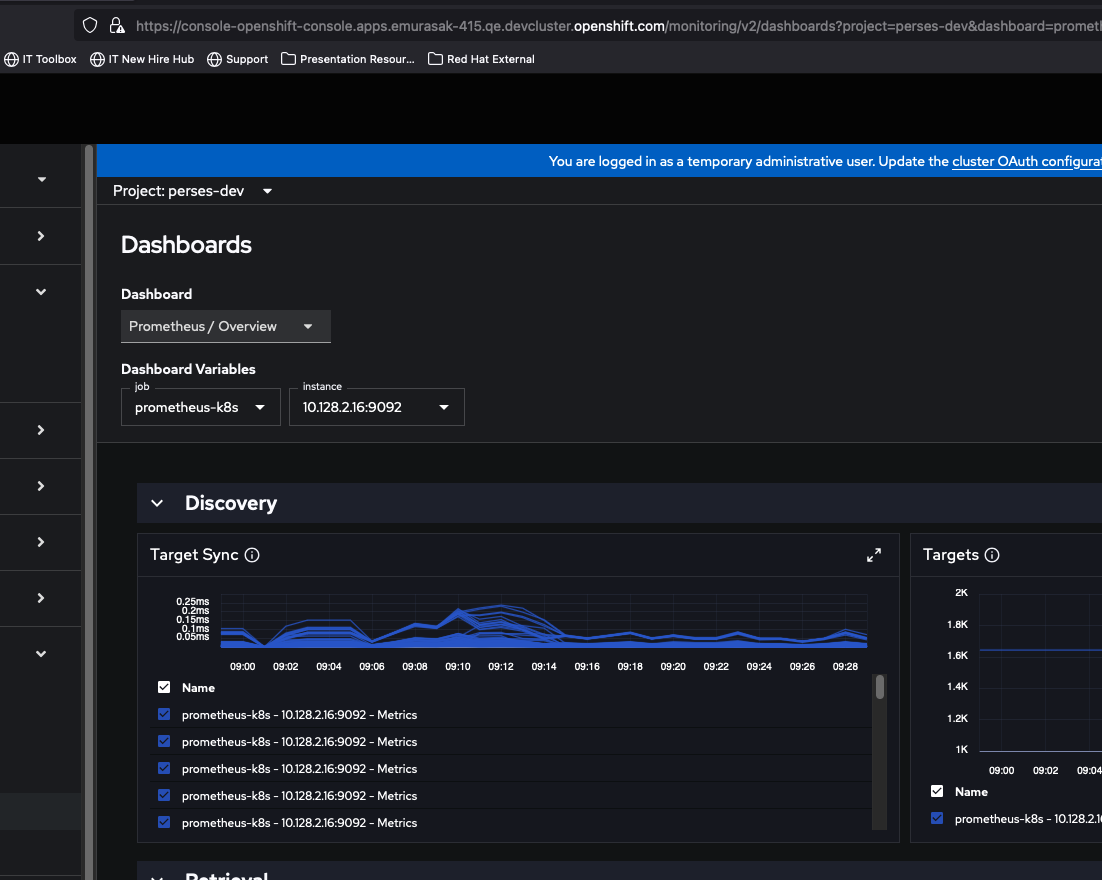
- Go back to Dashboards (Perses) and switch between the 2 namespaces with Prometheus / Overview dashboard
- Result: Dashboards are now different in the layout, but both are presenting the same content

First time:

Second time: it maintained the last layout


- blocks
-
OU-818 [COO1.2] - OBO testing - UIPlugin Regression testing
-

- Closed
-
- clones
-
-

- Verified
-
- is related to
-
COO-958 [QE] COO UI checking
-
- Closed
-
-
-
- Closed
-
-
-
- Closed
-
- relates to
-
OU-689 Add RBAC to Perses Dashboards in OpenShift
-
- Closed
-
- links to