-
Bug
-
Resolution: Unresolved
-
 Undefined
-
openshift-4.19
-
None
-
Quality / Stability / Reliability
-
False
-
-
1
-
Moderate
-
None
-
None
-
Sprint 270, Sprint 271
-
None
-
None
-
None
Pre-req:
- Clone monitoring-plugin repo and checkout the branch you use to test a PR, in this case "pf-6" branch
- Run following commands:
podman login quay.io //enter your username rh-ee-emurasak and password

podman build -f Dockerfile.dev --platform=linux/amd64 -t quay.io/<username>/monitoring-plugin:<tag>

podman push quay.io/rh-ee-emurasak/monitoring-plugin:<tag>
Under this folder: https://github.com/observability-ui/development-tools/tree/main/monitoring-plugin
- Run ./scale-down.sh
- Go To Deployments and search for monitoring
- Make sure there is no pod under cluster-monitoring-operator and monitoring-plugin Deployments
- Click on cluster-monitoring-operator deployment
- Edit YAML at this line referring to monitoring-plugin image: https://github.com/openshift/cluster-monitoring-operator/blob/5d1fd1bb52eeb9b2f877c45de0cf93e2f9fffb95/manifests/0000_50_cluster-monitoring-operator_05-deployment.yaml#L76
- Replace to your quay image: quay.io/rh-ee-emurasak/monitoring-plugin:<tag>
- Run ./scale-up.sh and make sure there will be 1 pod per cluster-monitoring-operator and monitoring-plugin
Steps to reproduce:
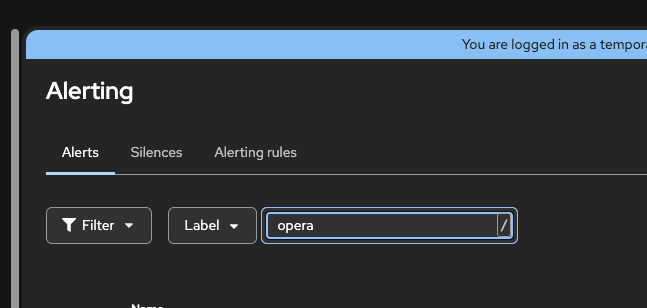
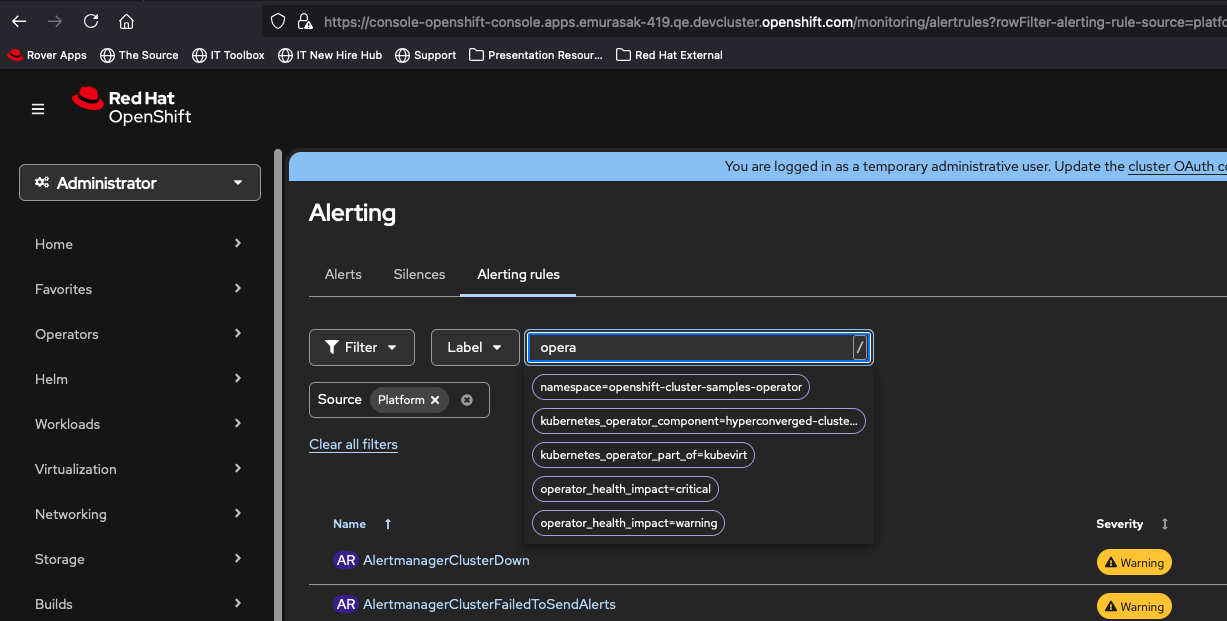
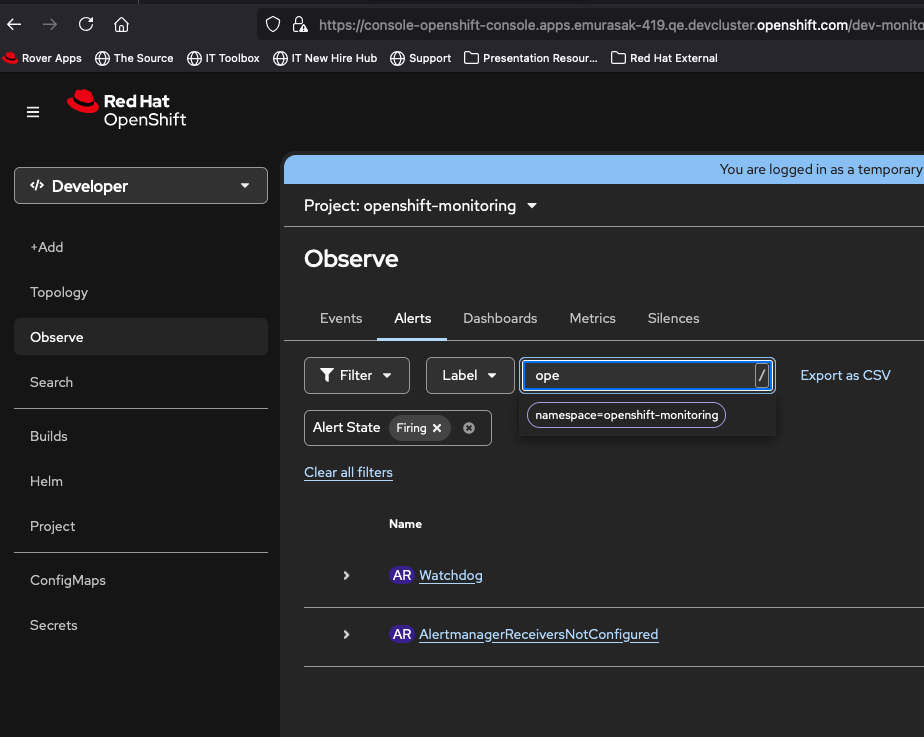
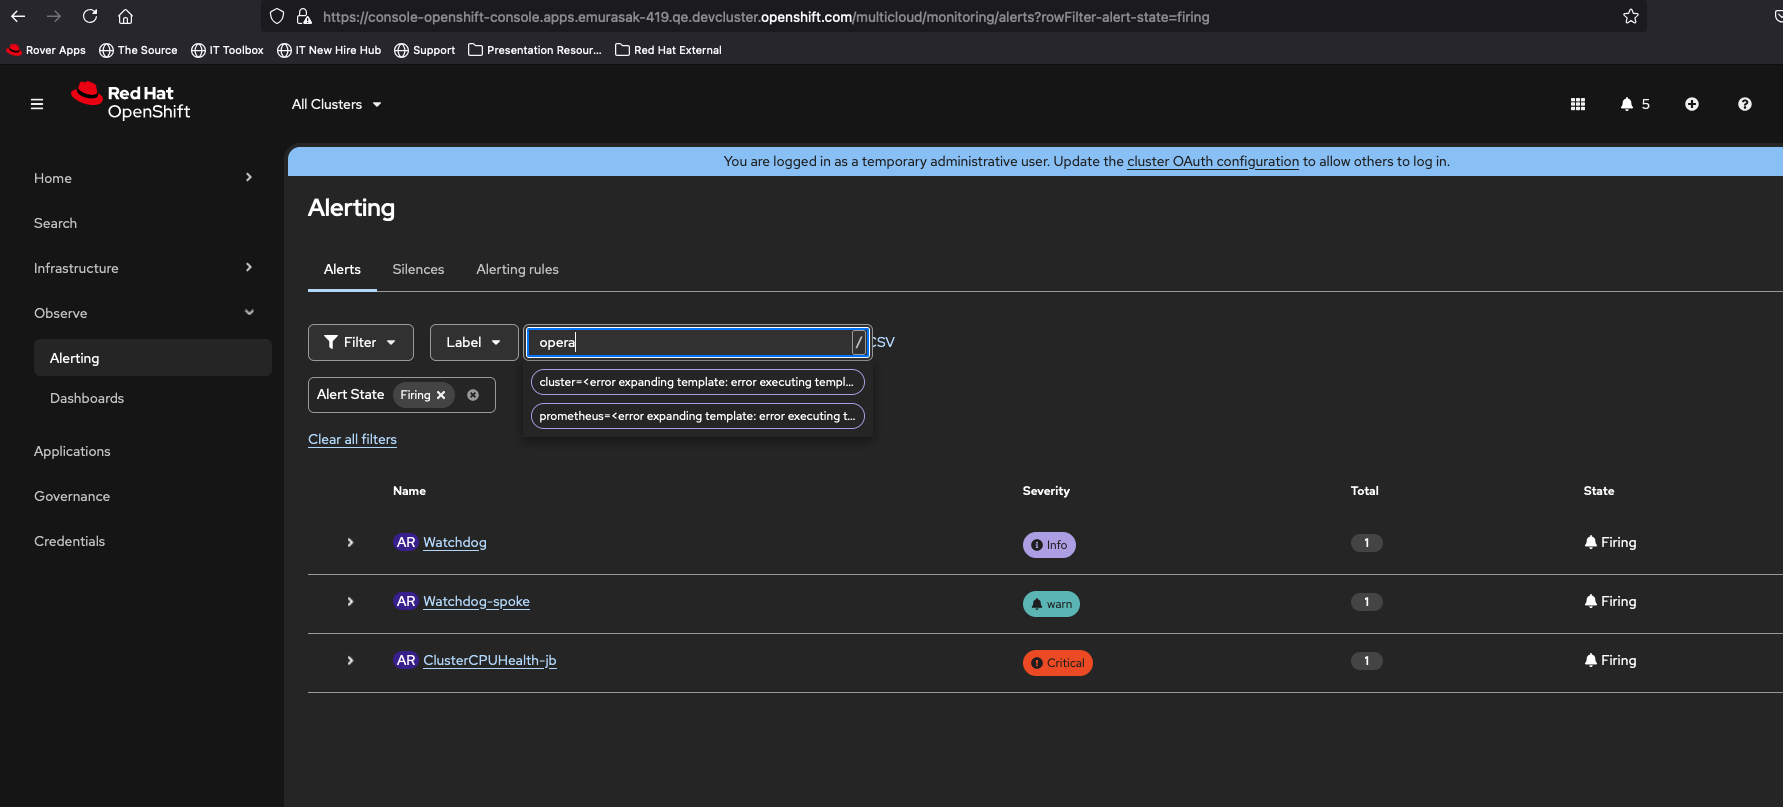
- Observe > Alerting > Alerts
- Change search option to LABELS
- Type "opera" => Result: there is no "autocomplete" option

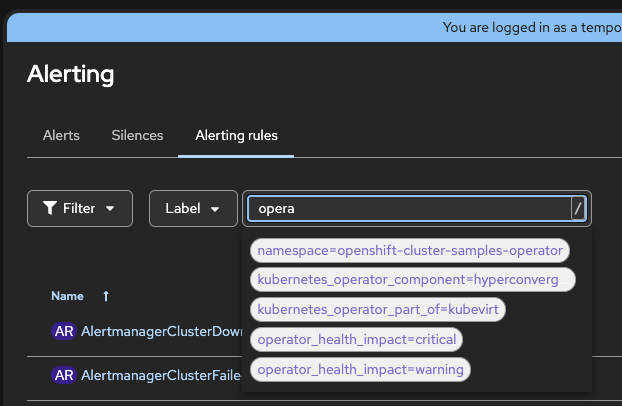
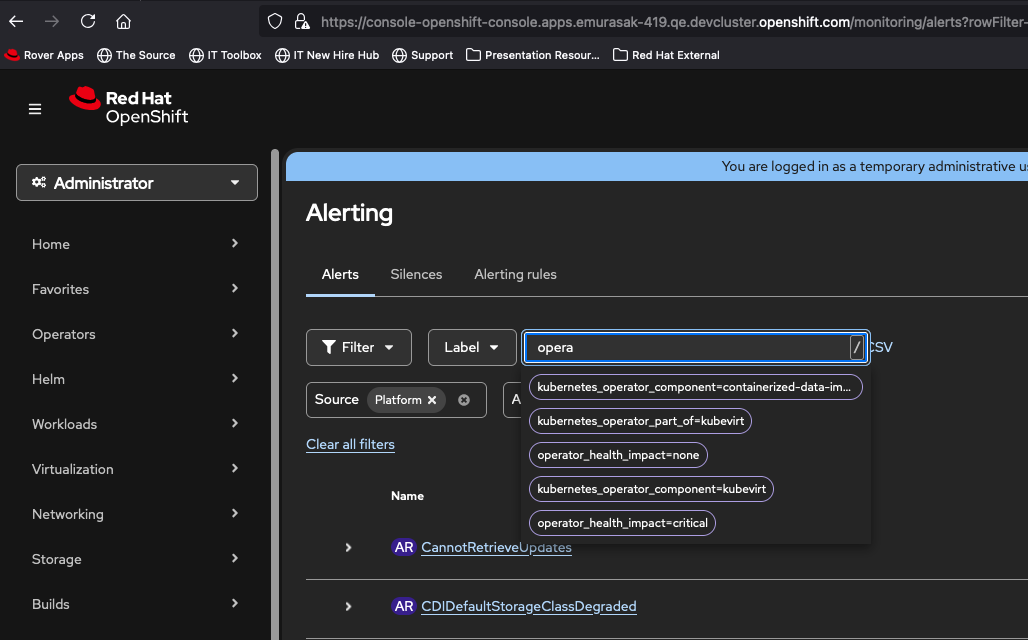
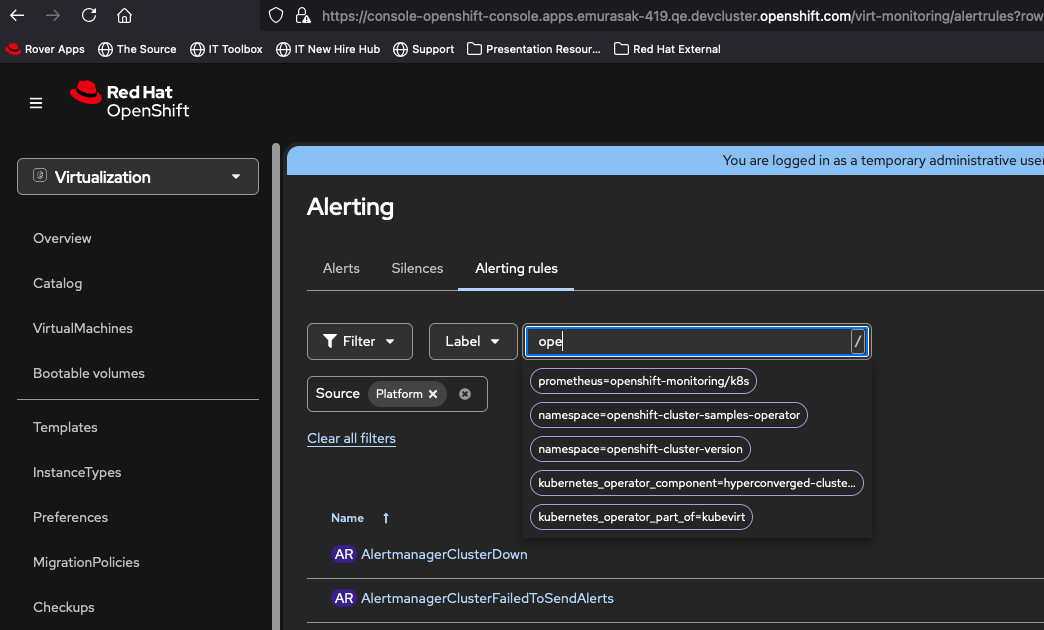
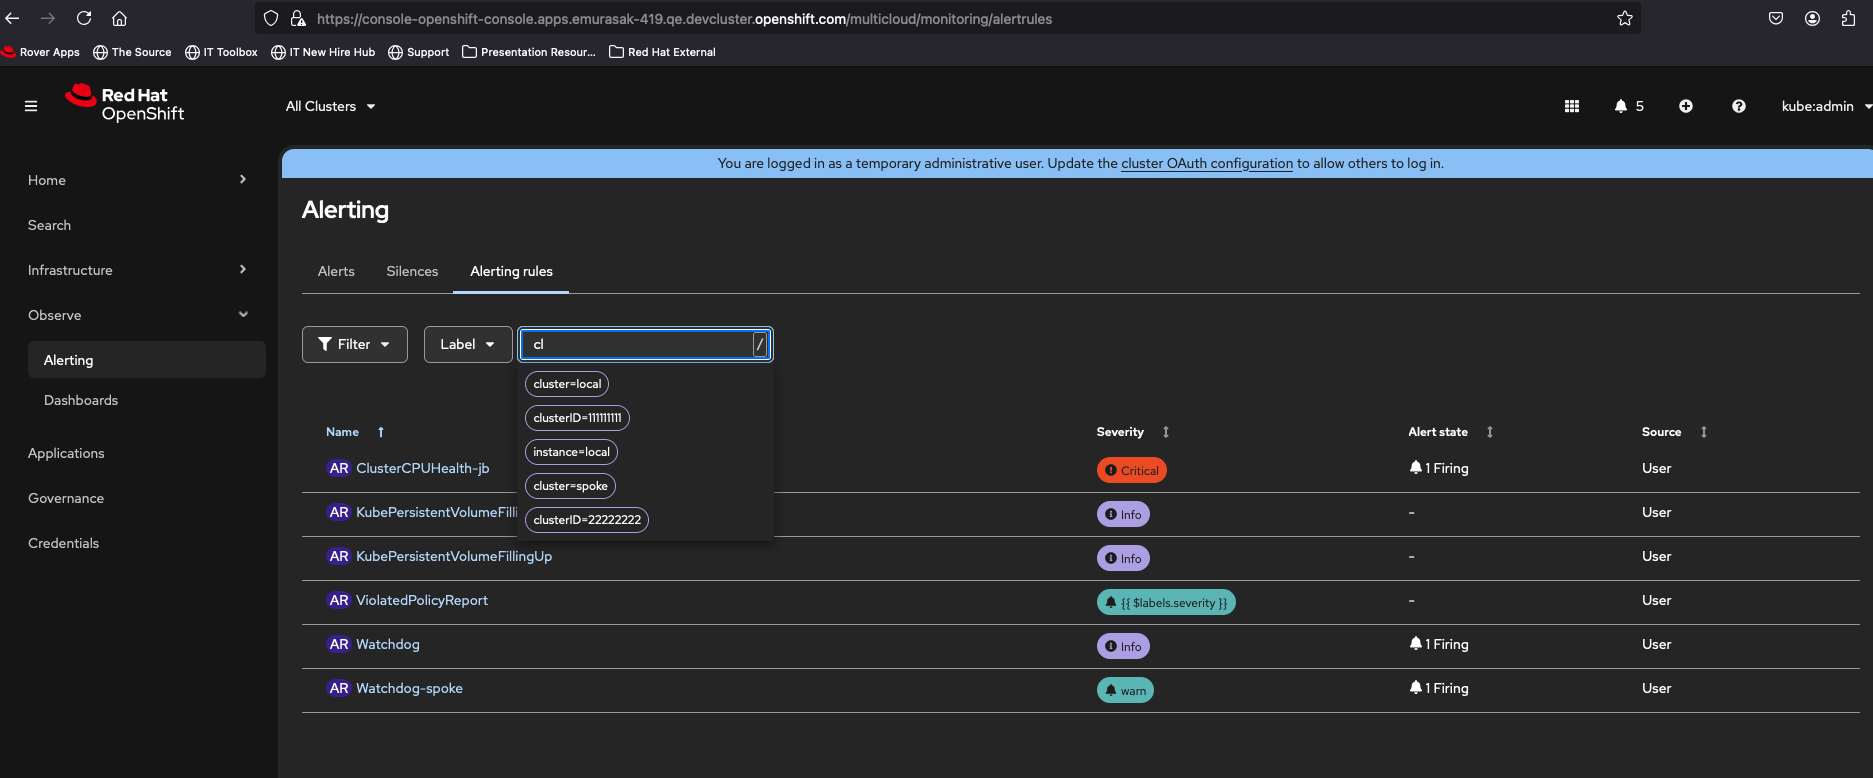
- Compare to Alerting rules page and Type "opera" and you will see

E2E Integration points:
- Bell Icon
- Select an alert -> it opens Alert Details page
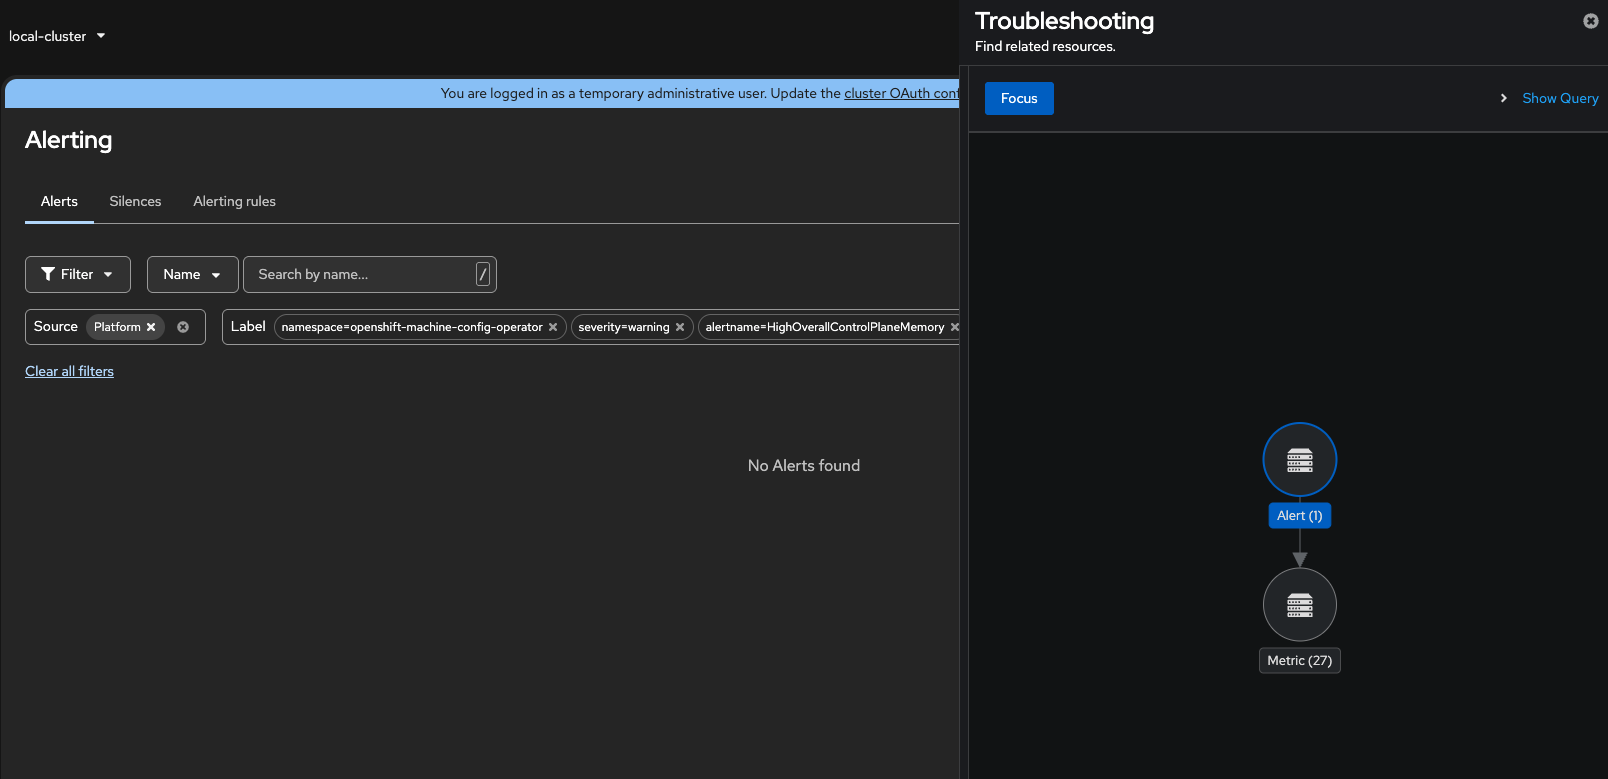
- When Troubleshooting panel Plugin is installed, it shows the link in the graph
- Click on Troubleshooting panel -> It displays a "topology" / flowchart
- Click on Metrics node in the flowchart
- Click now on Alerts node in the flowchart
- Result: It loads Alerts List page with labels added to the search criteria, but no alert is listed
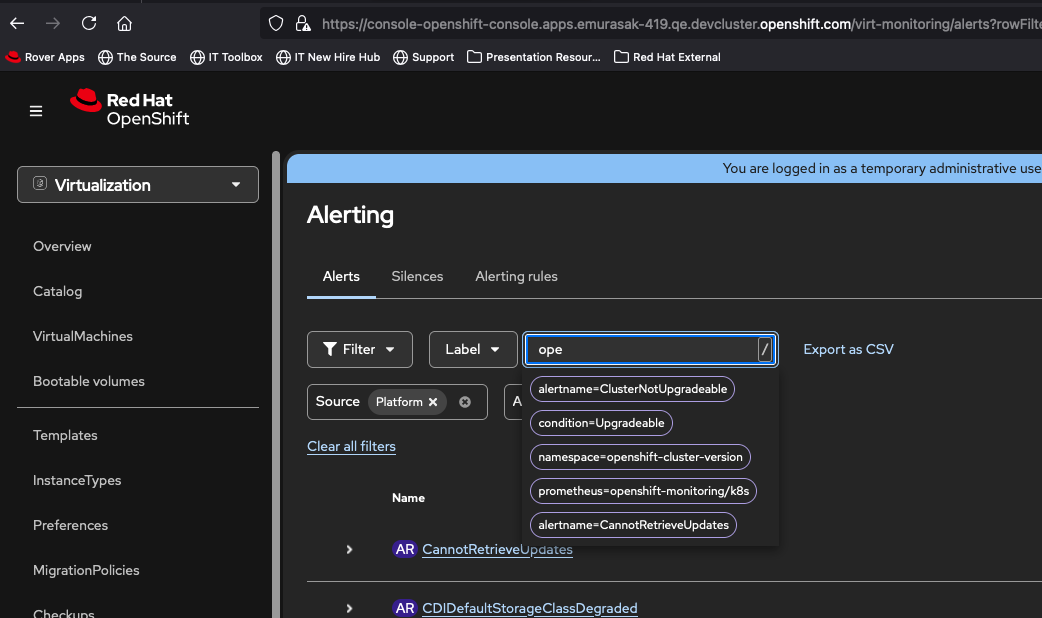
2nd E2E Scenario: Virtualization
- Install OpenShift Virtualization
- in Admin perspective, Virtualization > Overview > scroll down and check Alerts section
- Click on View all > Alerting page is loaded with pre-defined filters, including Label but empty page
- in Admin perspective, Virtualization > Overview > scroll down and check Alerts section
- Under Alerts, expand the Severity with alerts (in my case Warnings)
- Click on View warning link -> Alert details page is loaded successfully, it is not broken

- is related to
-
OU-659 Migrate the monitoring plugin to use patternfly 6
-
- Closed
-