-
Bug
-
Resolution: Unresolved
-
 Normal
-
None
-
Logging Plugin 6.0, Logging Plugin 6.1, Logging Plugin 6.2
-
None
-
Quality / Stability / Reliability
-
False
-
-
None
-
Important
-
None
-
None
-
None
-
None
-
None
-
None
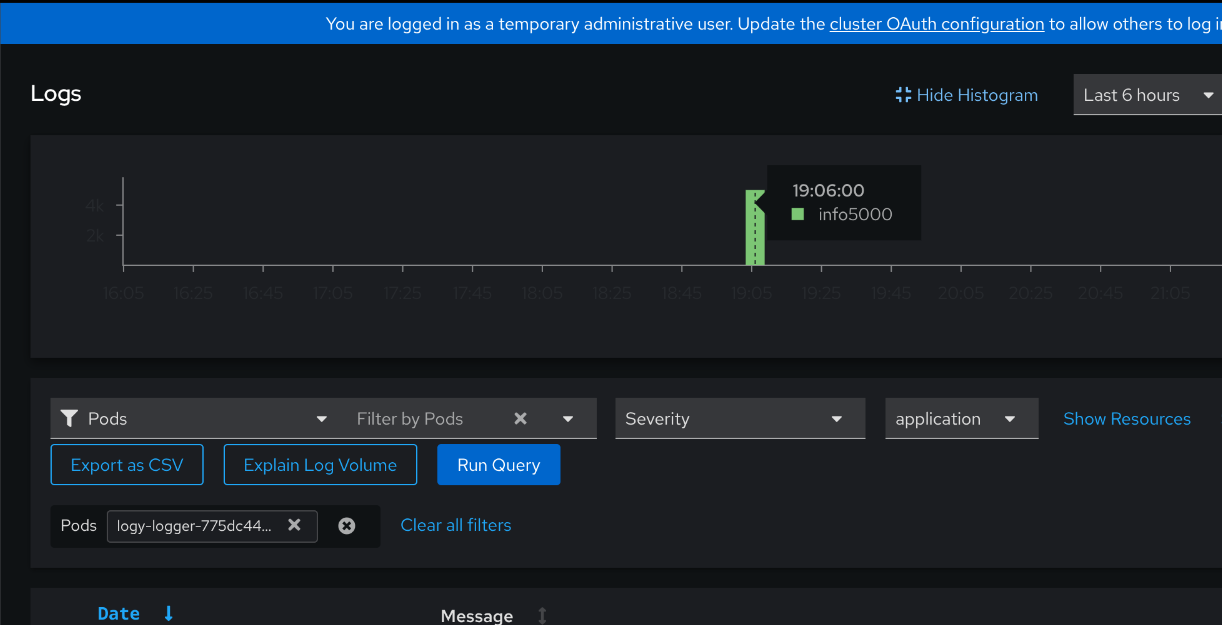
When using the OpenShift loki logs UI , the histogram shows a much larger number of results/rows returned than what is visible in the UI and exported to csv, even after exhausting the "Load more data" option.
Version-Release number of selected component (if applicable):
Cluster Observability Operator 1.1.0
How reproducible:
100%
Steps to Reproduce:
- Install and configure Red Hat OpenShift Logging 6.2 with LokiStack.
- Enable Logging UIPlugin
- Deploy application which generators 5000 logs per second.
kind: Deployment
apiVersion: apps/v1
metadata:
  name: logy-logger
  namespace: test
spec:
  replicas: 1
  selector:
    matchLabels:
      app: log-generator
  template:
    metadata:
      creationTimestamp: null
      labels:
        app: log-generator
    spec:
      containers:
        - name: log-generator
          image: registry.access.redhat.com/ubi8/python-39
          command:
            - python3
            - '-u'
            - '-c'
          args:
            - |
              import logging
              import time
              logging.basicConfig(level=logging.INFO, format="%(asctime)s %(levelname)s %(message)s")
              log_count = 0
              A = 1
              while A:
                  for _ in range(5000):  # Generates 5000 logs/sec
                      log_count += 1
                      logging.info(f"Log line {log_count}")
                  A = 0
                  time.sleep(99999)
          resources:
            limits:
              cpu: 500m
logs generated in below format from 1 to 5000 then sleep for 99999 seconds.
...
2025-04-10 13:31:26,912 INFO Log line 196
2025-04-10 13:31:26,912 INFO Log line 197
2025-04-10 13:31:26,912 INFO Log line 198
2025-04-10 13:31:26,912 INFO Log line 199
2025-04-10 13:31:26,912 INFO Log line 200
2025-04-10 13:31:26,912 INFO Log line 201
2025-04-10 13:31:26,912 INFO Log line 202
2025-04-10 13:31:26,912 INFO Log line 203
2025-04-10 13:31:26,912 INFO Log line 204
2025-04-10 13:31:26,912 INFO Log line 205
...
Now check same from UI
- Navigate to "Observe > Logs" menu in webconsole.
- Scroll to the bottom (while repeatedly clicking "More data available, click to load..." until the end is reached)
- screenshot shows missing log line number : 160 to 228(random lines)
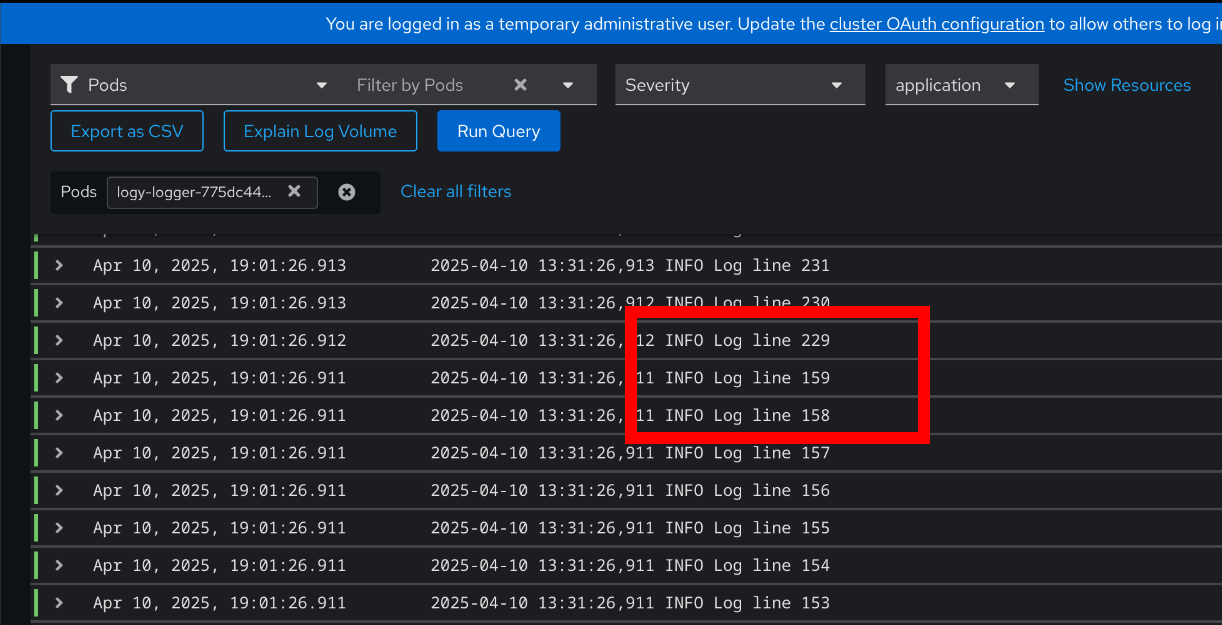
4. click on export as csv : log lines missing (gives 3001 log records out of 5000)
5. missing logs can be searched through content filter : INFO log line 160 to 228
6. histogram shows correct log line records : 5000 log records in total.
7. Integrated loki with grafana, and it gives correct results, exported csv shows all log records. (5000/5000)


- links to
