-
Bug
-
Resolution: Unresolved
-
 Minor
Minor
-
None
-
COO 1.2.0, COO 1.0.0
-
Quality / Stability / Reliability
-
False
-
-
1
-
Moderate
-
None
-
None
-
None
-
None
-
None
-
None
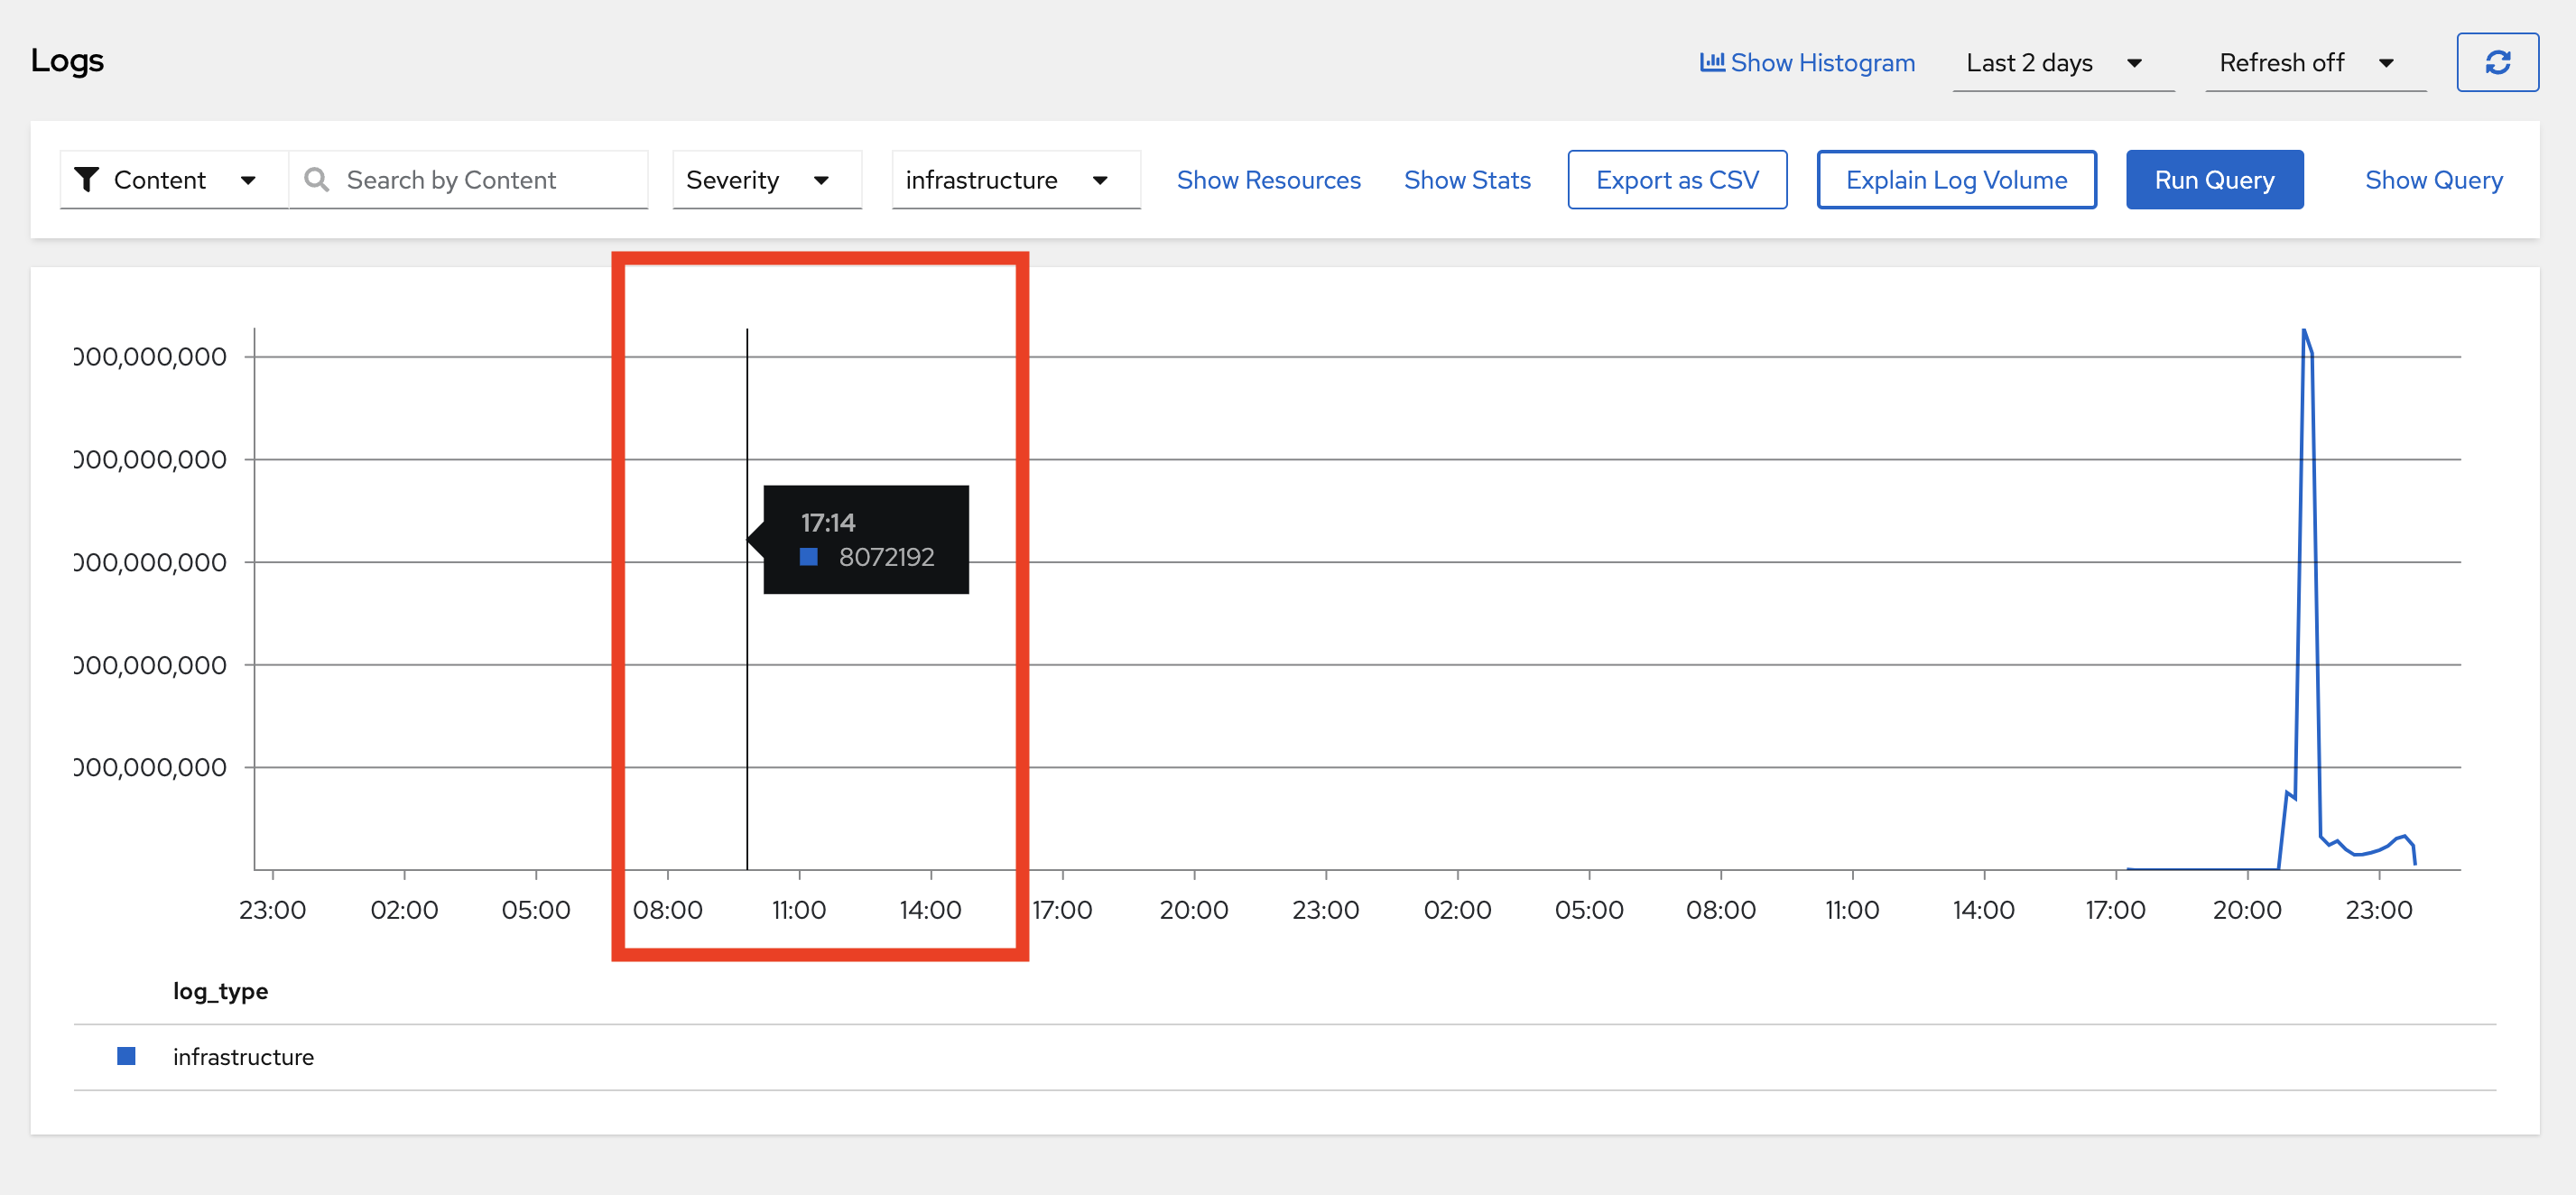
Description of problem:
When checking the log volume in "Observe > Logs" provisioned using Logging UIPlugin, and selecting Explain Log Volume option and hovering the cursor over the generated graph, then the time wrt metric is incorrect. Refer the attached snippet.
Version-Release number of selected component (if applicable):
Cluster Observability Operator 1.0.0/1.2.0
RHOL with LokiStack 6.2.0/6.3.0
How reproducible:
100%
Steps to Reproduce:
- Install and configure Red Hat OpenShift Logging 6.2/6.3 with LokiStack.
- Enable Logging UIPlugin
- Navigate to "Observe > Logs" menu in webconsole.
- Click on Explain Log Volume option and hover over graph and see the time that it shows is wrong. Refer attached snippet.
Actual results:
When hovering over the graph generated by "Explain Log Volume" option, the time that shows wrt is incorrect.
Expected results:
Date should be visible on x-axis along with time to identify the correct date of the metric.
Additional info:
Attached snippet.
- is duplicated by
-
-

- Closed
-
