-
Bug
-
Resolution: Unresolved
-
Normal
-
None
-
OpenShift 4.16, openshift-4.17
-
Quality / Stability / Reliability
-
False
-
-
3
-
None
-
None
-
None
-
Sprint 279, Sprint 281, Sprint 285
-
Customer Escalated
-
None
-
None
-
None
A user with the clusterrole `alertingrules.loki.grafana.com-v1-admin` cannot see custom loki log alerts in the admin console as expected: [1]
This cluster role grants permissions to create, read, update, delete, list, and watch {{AlertingRule}} resources within the {{loki.grafana.com/v1}} API group.
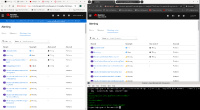
See attached image: on the left, the kubeadmin user is logged in, note the alert firing for `TestappHighErrorRate` - this is a loki custom log alert as is detailed in this article [2]
on the top right, user3 is logged in, notice the alert is missing.
the bottom right shows that user3, has clusteradmin - required to acces the parent navigtion of "observe"
in addition they also have a clusterrole granting access to all application logs...as well as the cluster role grating explicit access to loki alerting rules
- alertingrules.loki.grafana.com-v1-admin
- links to
