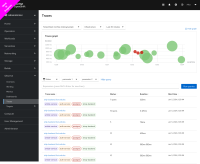
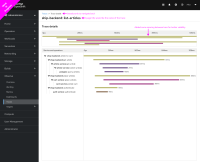
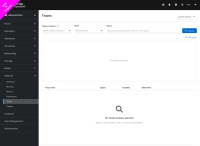
Hi agerstma@redhat.com I've created two mockups with PatternFly guidelines for you. The first screen shows Tracing in the use case with empty states. In other words, no query has been entered. It might be the case that we will never have empty states on this page. To be discussed. The second screen shows the page when a query has been entered. I wasn't sure of the colorful labels so I used plain ones with no numbers inside them, the ones underneath the Traces' names. Also to be discussed. To be discussed: * Empty states for charts and table
- Labels in the Trace Names column
- Tooltips for the chart - what we can show when a user hovers over chart items
- Span column or Status column
- How does the user return to the main Traces chart after clicking and drilling down into the second view?
Here's a link to the pages, you can click on the "Run query/s" button to see the next screen. Click on the "X" to return to the first screen, or use your keyboard arrow keys, left + right.
https://www.figma.com/proto/nu6rKYMxt2VzhNhu5OJoJp/Tracing-Grantt-Chart-UI-Fixes?no[…]ent-scaling=fixed&page-id=0%3A1&starting-point-node-id=4%3A164 (edited)
Sub-task
Undefined
OU-482 Implement UX changes to match with Patternfly UI


The charts have been implemented, reviewed, and aligned to PatternFly within technical feasibility.