Description of problem:
Dashboards are not showing the correct data for memory consumption, the data is shown correctly when inspecting the metric.
Version-Release number of selected component (if applicable):
4.12
How reproducible:
Always
Steps to Reproduce:
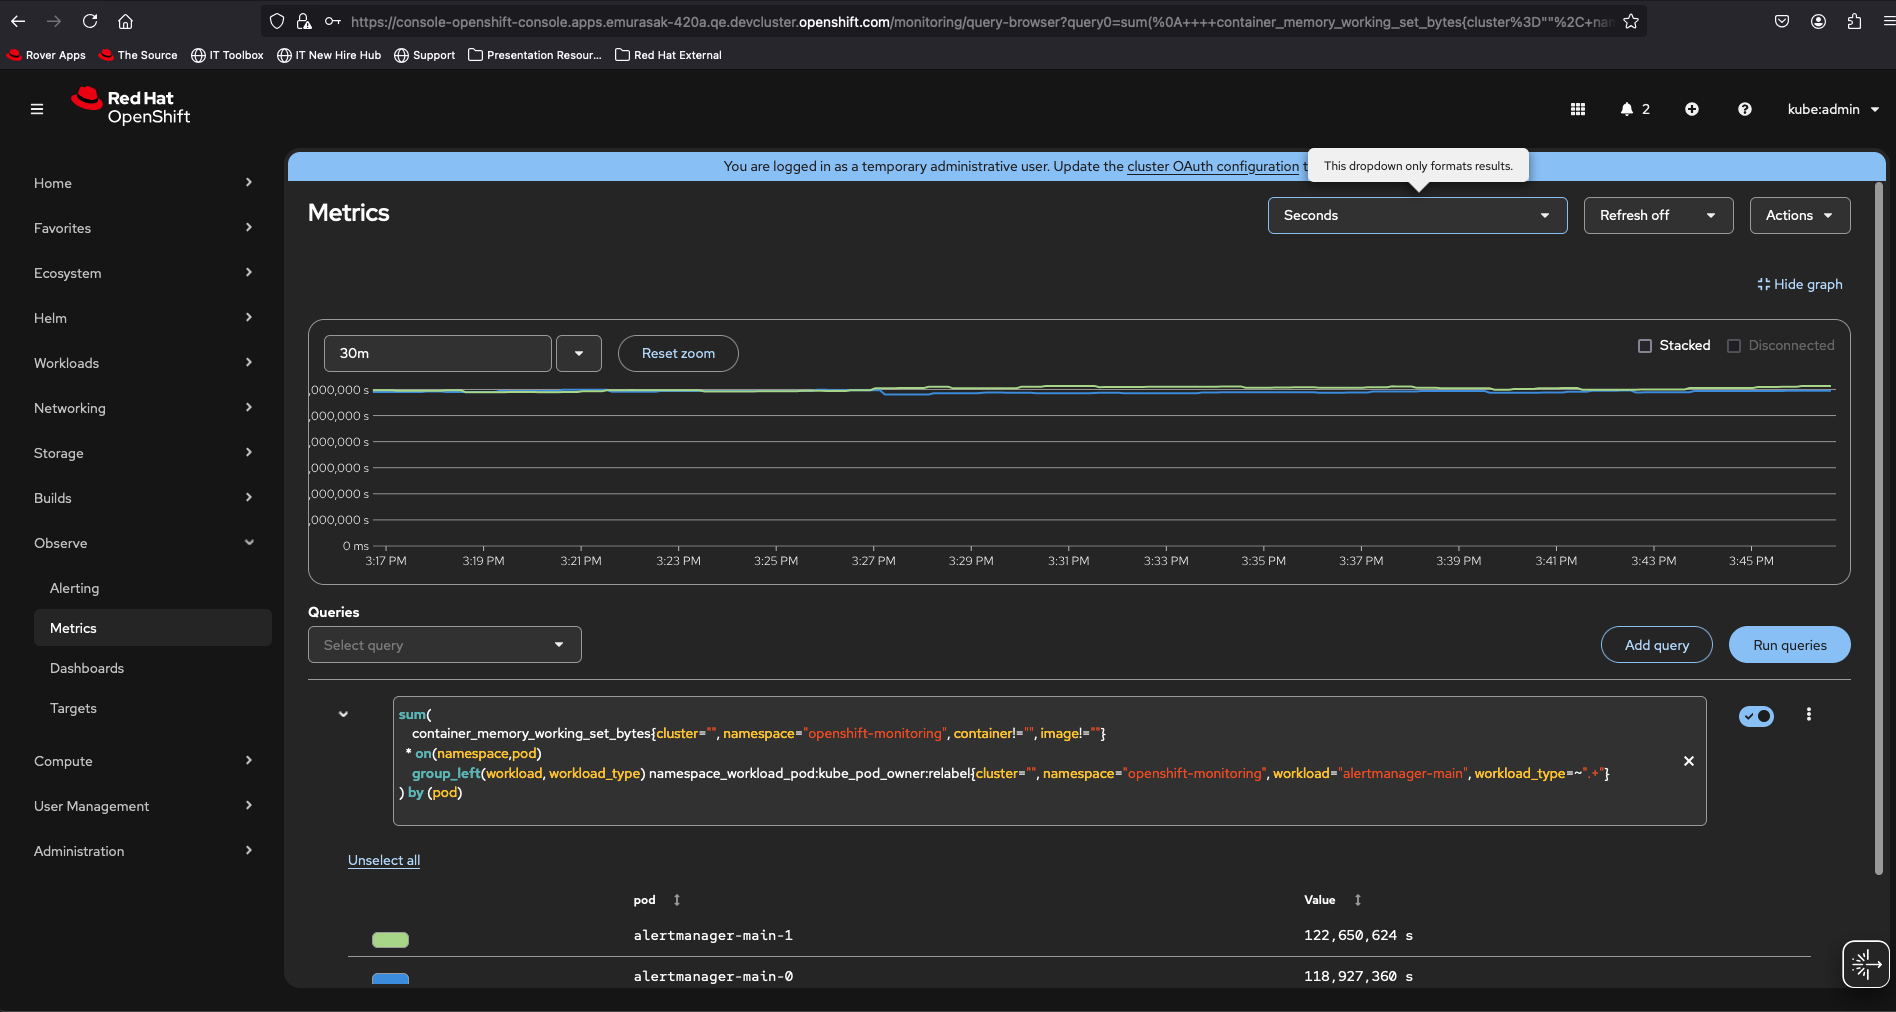
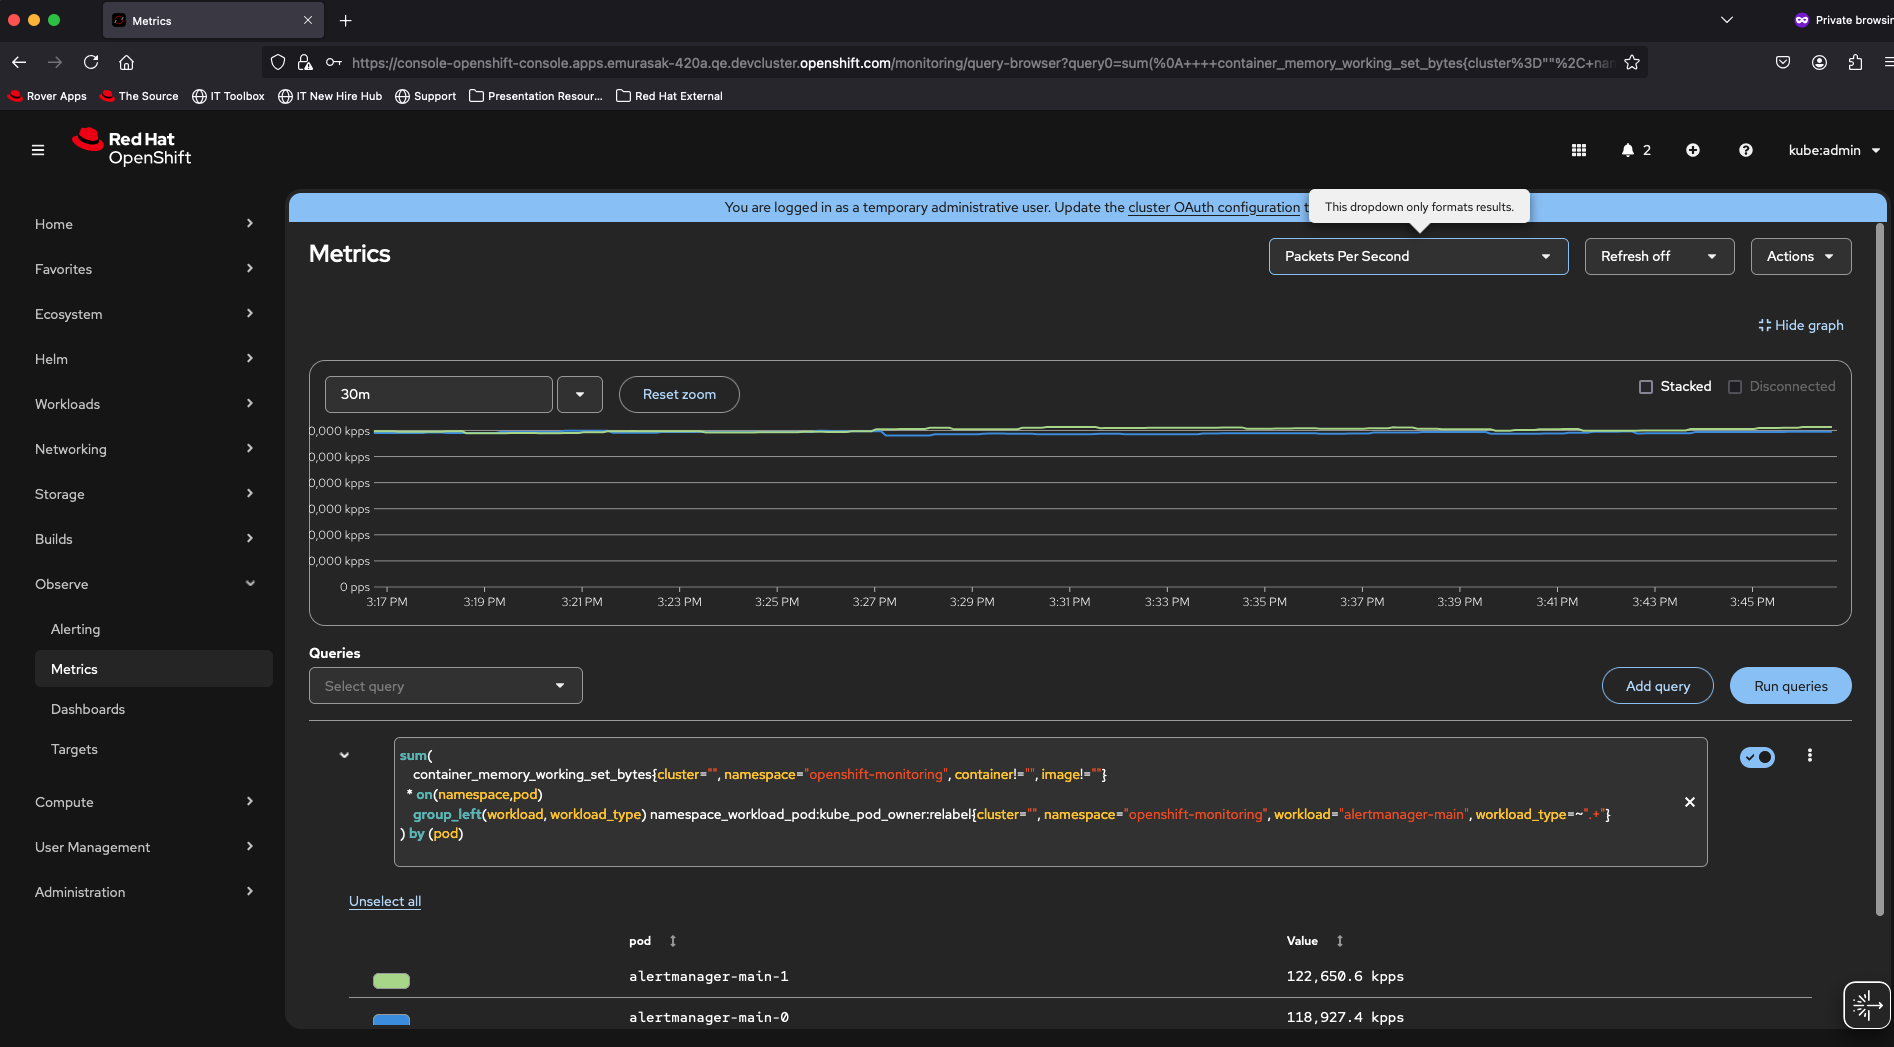
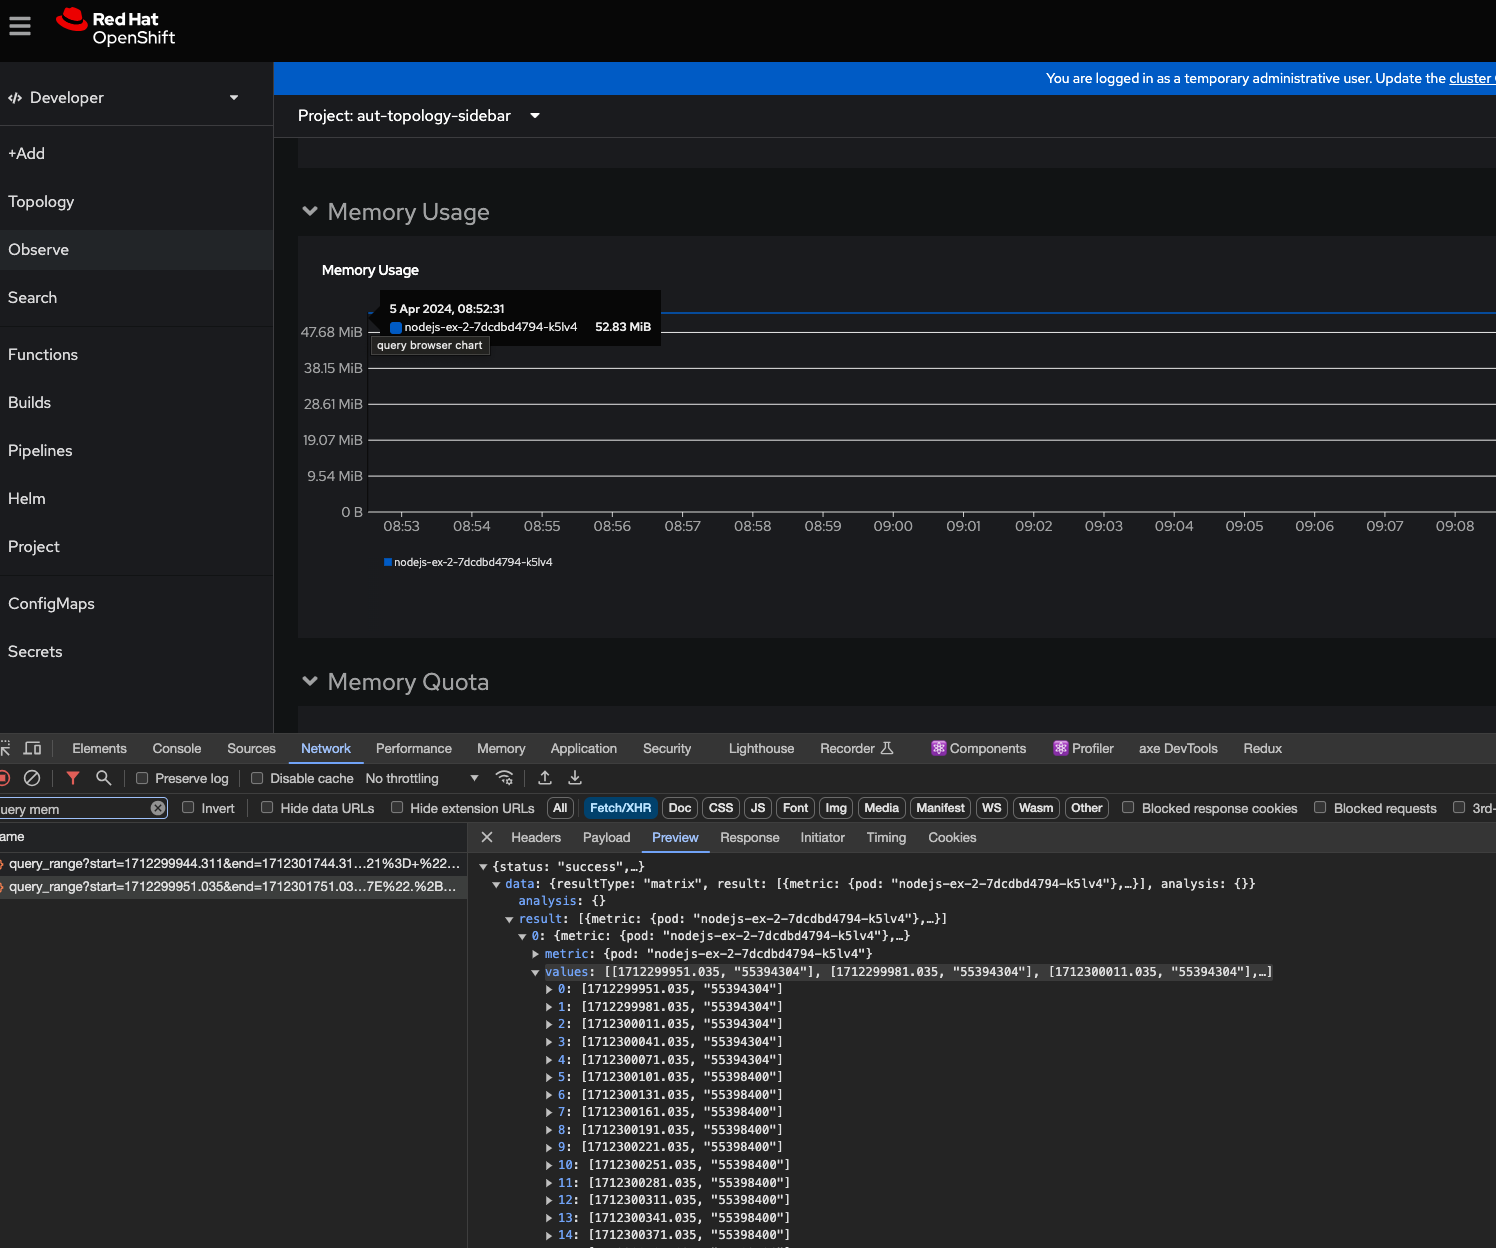
1. Navigate to observe dashboards
2. Select the Kubernetes / Compute / Resource Workload
3. scroll down to the memory consumption chart
4. compare the chart results with the prometheus query results
Actual results:
Results do not match with the metrics returned by prometheus
Expected results:
Result values match with the prometheus response
Additional info:
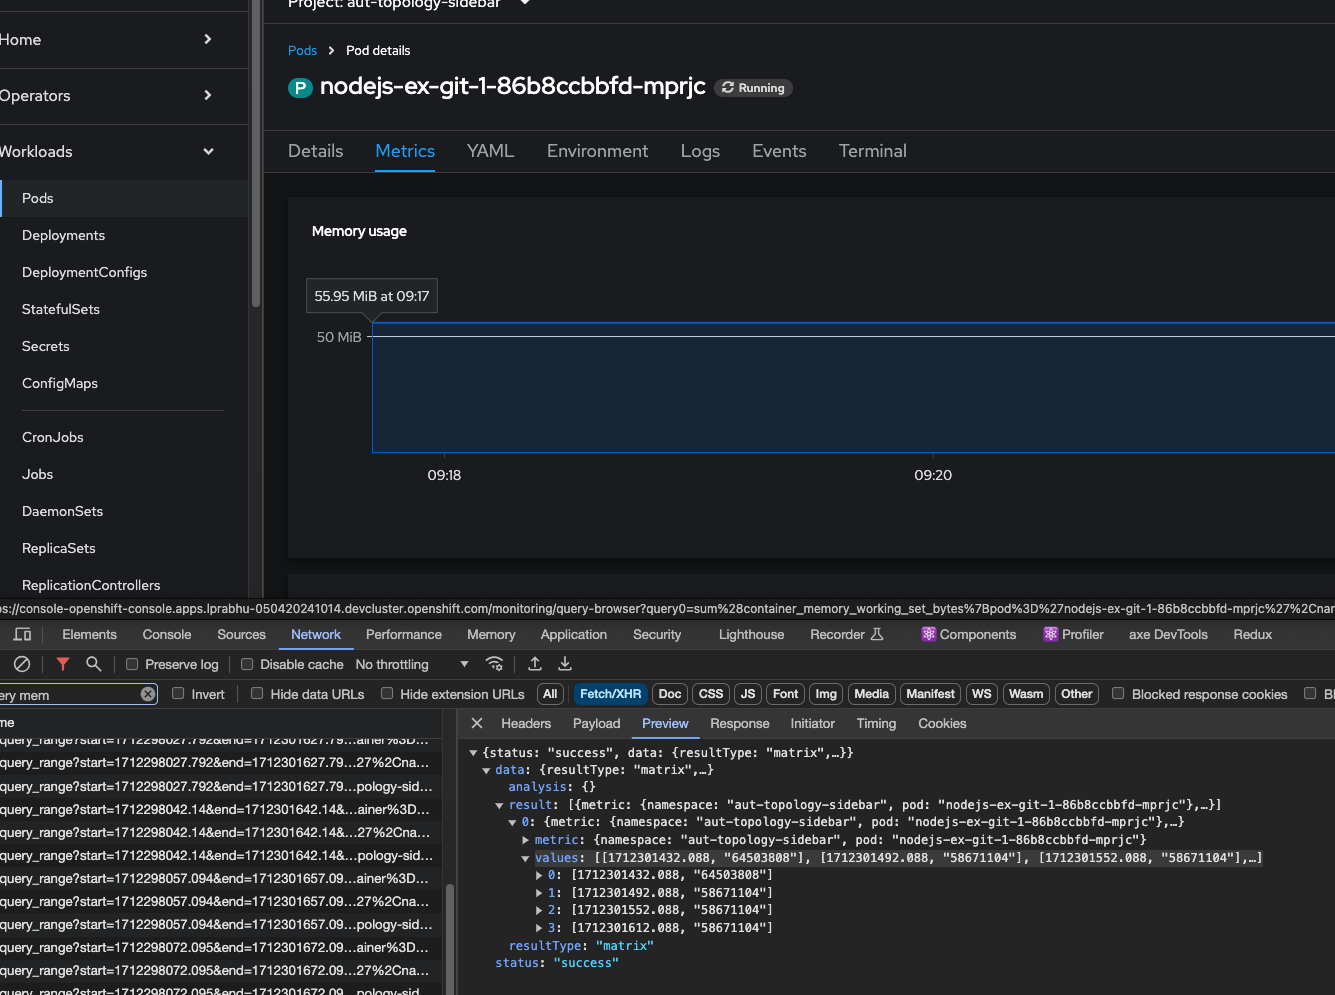
The issue also occurs in the Workload / Pod / Metrics
- relates to
-
OU-957 [Query Browser] Large Values of Seconds and PPS are cut off
-

- To Do
-
- links to