-
Task
-
Resolution: Done
-
Undefined
-
None
-
None
-
None
-
Product / Portfolio Work
-
False
-
-
False
-
5
-
None
-
None
-
Sprint 257, Sprint 258
Background
The admin console's alert details page is provided by https://github.com/openshift/monitoring-plugin, but the dev console's equivalent page is still provided by code in the console codebase.
The UX of the two pages differs somewhat, so we will need to decide whether we can change the dev console to use the same UX as the admin page or whether we need to keep some differences. This is an opportunity to bring the improved PromQL editing UX from the admin console to the dev console.
Outcomes
- The dev console metrics is loaded from monitoring-plugin and the code that is not shared with other components in the console is removed from the console codebase.
- The dev console version of the page has the project selector dropdown, but the admin console page doesn't, so monitoring-plugin will need to be changed to support that difference.
—
Duplicate issue of https://issues.redhat.com/browse/CONSOLE-4187
To pass the CI/CD requirements of the openshift/console each PR needs to have a issue in a OCP own Jira board.
This issue migrates the rendering of the Developer Perspective > Observe > Metrics page from the openshift/console to openshift/monitioring-plugin.
openshift/console PR#4187: Removes the Metrics Page.
openshift/monitoring-plugin PR#138: Add the Metrics Page & consolidates the code to use the same components as the Administrative > Observe > Metrics Page.
—
Testing
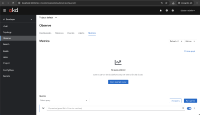
Both openshift/console PR#4187 & openshift/monitoring-plugin PR#138 need to be launched to see the full feature. After launching both the PRs you should see a page like the screenshot attached below.
—
- depends on
-
OU-262 UX assessment for Dev / Admin console consolidation of Metrics page
-
- Closed
-
- is duplicated by
-
OCPBUGS-38462 2 Metrics tab in 4.17 developer console
-
- Closed
-
- links to
