-
Bug
-
Resolution: Duplicate
-
 Undefined
-
None
-
OpenShift 4.12, OpenShift 4.13
-
Quality / Stability / Reliability
-
False
-
-
None
-
None
-
None
-
None
-
None
-
None
-
None
-
None
see from OCPBUGS-4431, KubePodNotScheduled is added to 4.12,
        - alert: KubePodNotScheduled
          annotations:
            description: |-
              Pod {{ $labels.namespace }}/{{ $labels.pod }} cannot be scheduled for more than 30 minutes.
              Check the details of the pod with the following command:
              oc describe -n {{ $labels.namespace }} pod {{ $labels.pod }}
            summary: Pod cannot be scheduled.
          expr: last_over_time(kube_pod_status_unschedulable{namespace=~"(openshift-.*|kube-.*|default)"}[5m])
            == 1
          for: 30m
          labels:
            severity: warning
tested on 4.12.0-0.nightly-2022-12-04-160656 with the following example to trigger the alert
apiVersion: apps/v1
kind: Deployment
metadata:
  labels:
    app: prometheus-example-app
  name: prometheus-example-app
  namespace: default
spec:
  replicas: 1
  selector:
    matchLabels:
      app: prometheus-example-app
  template:
    metadata:
      labels:
        app: prometheus-example-app
    spec:
      containers:
      - image: ghcr.io/rhobs/prometheus-example-app:0.4.0
        imagePullPolicy: IfNotPresent
        name: prometheus-example-app
        securityContext:
          allowPrivilegeEscalation: false
          capabilities:
            drop:
            - ALL
      nodeSelector:
        disktype: ssd
      securityContext:
        runAsNonRoot: true
        seccompProfile:
          type: RuntimeDefault
checked from alertmanager API, annotations.description is right for KubePodNotScheduled alert
# token=`oc create token prometheus-k8s -n openshift-monitoring`
# oc -n openshift-monitoring exec -c prometheus prometheus-k8s-0 -- curl -k -H "Authorization: Bearer $token" 'https://alertmanager-main.openshift-monitoring.svc:9094/api/v2/alerts' | jq
...
  {
    "annotations": {
      "description": "Pod default/prometheus-example-app-766ddd6bc4-5s4j2 cannot be scheduled for more than 30 minutes.\nCheck the details of the pod with the following command:\noc describe -n default pod prometheus-example-app-766ddd6bc4-5s4j2",
      "summary": "Pod cannot be scheduled."
    },
    "endsAt": "2022-12-05T03:27:20.407Z",
    "fingerprint": "3e90a7d55af10e4e",
    "receivers": [
      {
        "name": "Default"
      }
    ],
    "startsAt": "2022-12-05T03:20:20.407Z",
    "status": {
      "inhibitedBy": [],
      "silencedBy": [],
      "state": "active"
    },
    "updatedAt": "2022-12-05T03:23:20.486Z",
    "generatorURL": "https:/console-openshift-console.apps.qe-ui412-1205.qe.devcluster.openshift.com/monitoring/graph?g0.expr=last_over_time%28kube_pod_status_unschedulable%7Bnamespace%3D~%22%28openshift-.%2A%7Ckube-.%2A%7Cdefault%29%22%7D%5B5m%5D%29+%3D%3D+1&g0.tab=1",
    "labels": {
      "alertname": "KubePodNotScheduled",
      "container": "kube-rbac-proxy-main",
      "endpoint": "https-main",
      "job": "kube-state-metrics",
      "namespace": "default",
      "openshift_io_alert_source": "platform",
      "pod": "prometheus-example-app-766ddd6bc4-5s4j2",
      "prometheus": "openshift-monitoring/k8s",
      "service": "kube-state-metrics",
      "severity": "warning",
      "uid": "f1da7d94-6451-4916-a476-d8ad7c3768ab"
    }
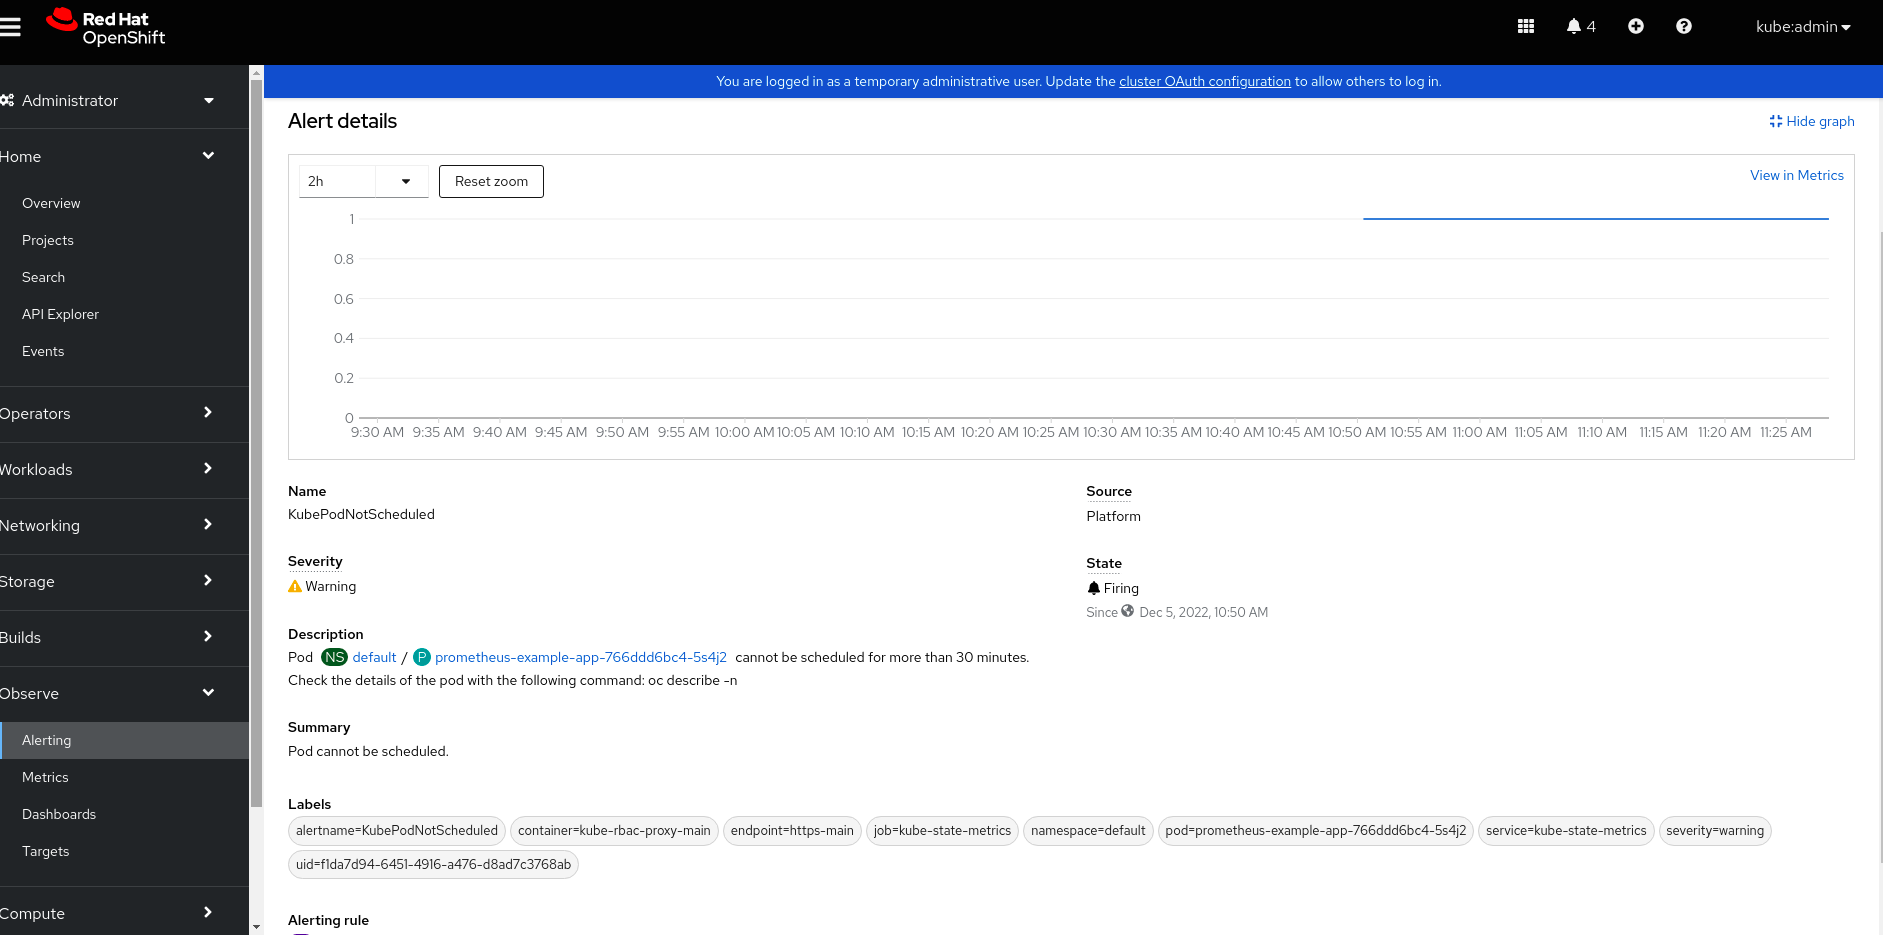
but from admin console, the Description part missed "default pod prometheus-example-app-766ddd6bc4-5s4j2" after
Check the details of the pod with the following command: oc describe -n