Uploaded image for project: 'Observability UI'
  1. Observability UI
  2. OU-1014

[Incidents] Alert start and end date are not rendered correctly

XMLWordPrintable

    • None
    • None
    • None
    • None
    • None
    • None

      CASE WITH 2 DATA POINTS

      See incidents_2dp.jsonand alerts_2dp.json

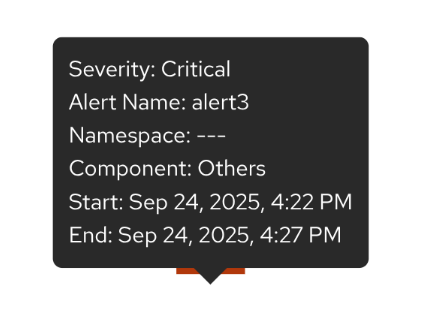
      When the alerts query is returning 2 datapoints, T1 and T2:

      ACTUAL: T2 is rendered as start date, no bar is rendered.

      EXPECTED: T1 is start date, T2 is end date, bar is rendered

      CASE WITH 3 DATA POINTS

      See incidents_3dp.jsonand alerts_3dp.json

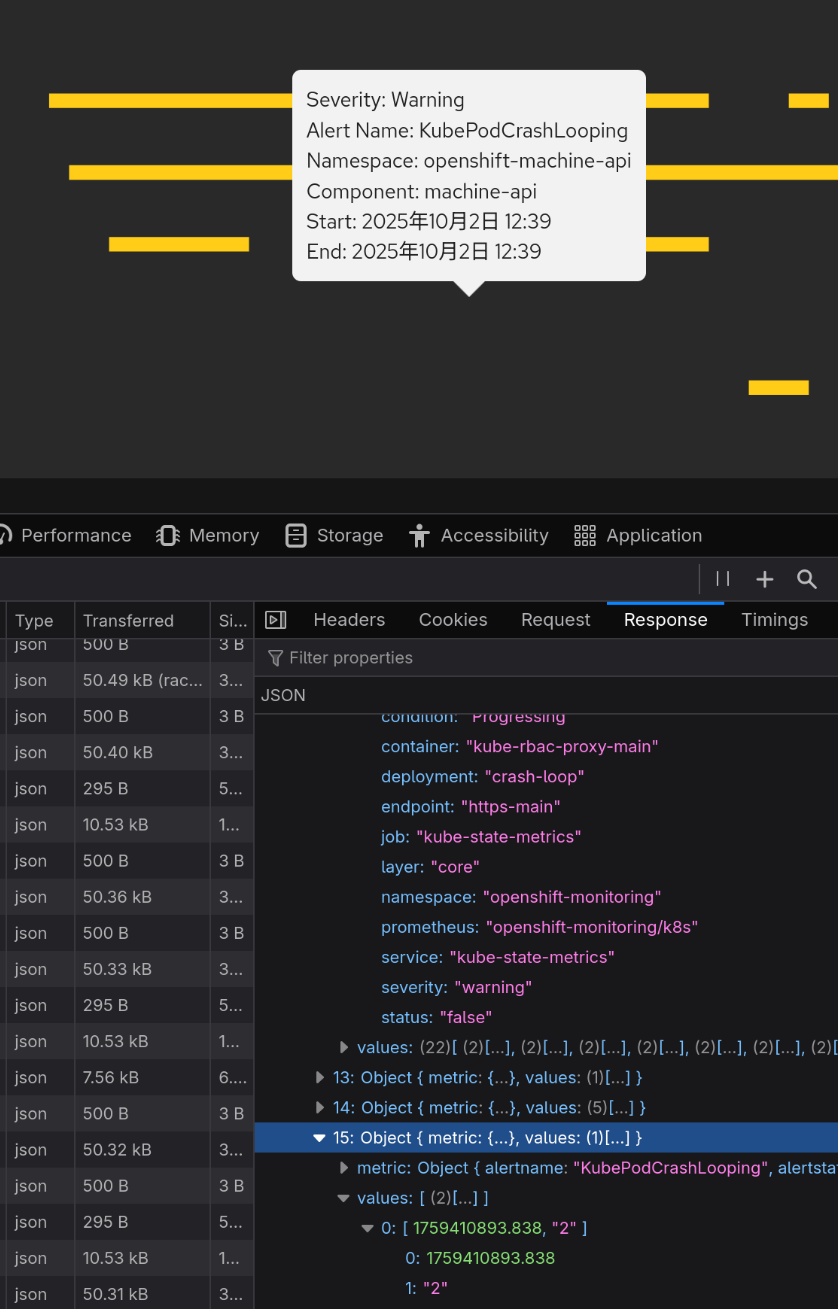
      When the alerts query is returning 3 datapoints, T1 and T2 and T3:

      ACTUAL: T1 is start date, T2 is end date, bar is rendered

      EXPECTED: T1 is start date, T3 is end date, bar is rendered

      The wrong end date is also breaking the resolved/firing state of the alert

      avoznese@redhat.com reproduce the bug with oc apply -f alert2.yaml. Install cluster health analyzer first of course (pull the latest main)

        1. image-2025-09-24-16-51-42-372.png
          30 kB
          Alberto Falossi
        2. alerts_3dp.json
          8 kB
          Alberto Falossi
        3. incidents_2dp.json
          1 kB
          Alberto Falossi
        4. alerts_2dp.json
          4 kB
          Alberto Falossi
        5. incidents_3dp.json
          1 kB
          Alberto Falossi
        6. alert2.yaml
          0.5 kB
          Alberto Falossi
        7. image-2025-10-02-16-42-20-992.png
          239 kB
          David Rajnoha
        8. image-2025-10-02-16-43-43-187.png
          239 kB
          David Rajnoha

              afalossi@redhat.com Alberto Falossi
              afalossi@redhat.com Alberto Falossi
              None
              David Rajnoha David Rajnoha
              Votes:
              0 Vote for this issue
              Watchers:
              3 Start watching this issue

                Created:
                Updated:
                Resolved: