OpenShift 4.18.3
kiali: 2.4.4
0.119.0-2 --> telemetry
servicemesh -> 3.0.1
tempo: 0.15.4-1
//ISSUE:
We have two clusters that are currently running the versioning above and are having trouble with visual output. Traffic being generated from outside the cluster is visualized but traffic generated from inside a container is not shown.
MTLS is not visualized, lock icons are not shown (even though we have security toggle enabled), and we have cluster-wide MTLS enabled and yet no banner is showing as expected.
Traffic graph even showing IDLE connections or long-timeframe does not show data as expected.
tempo, kiali and ossm + open telemetry configs match documentation and expected configuration - need assistance in identifying the root of the error with visualized traffic flow.
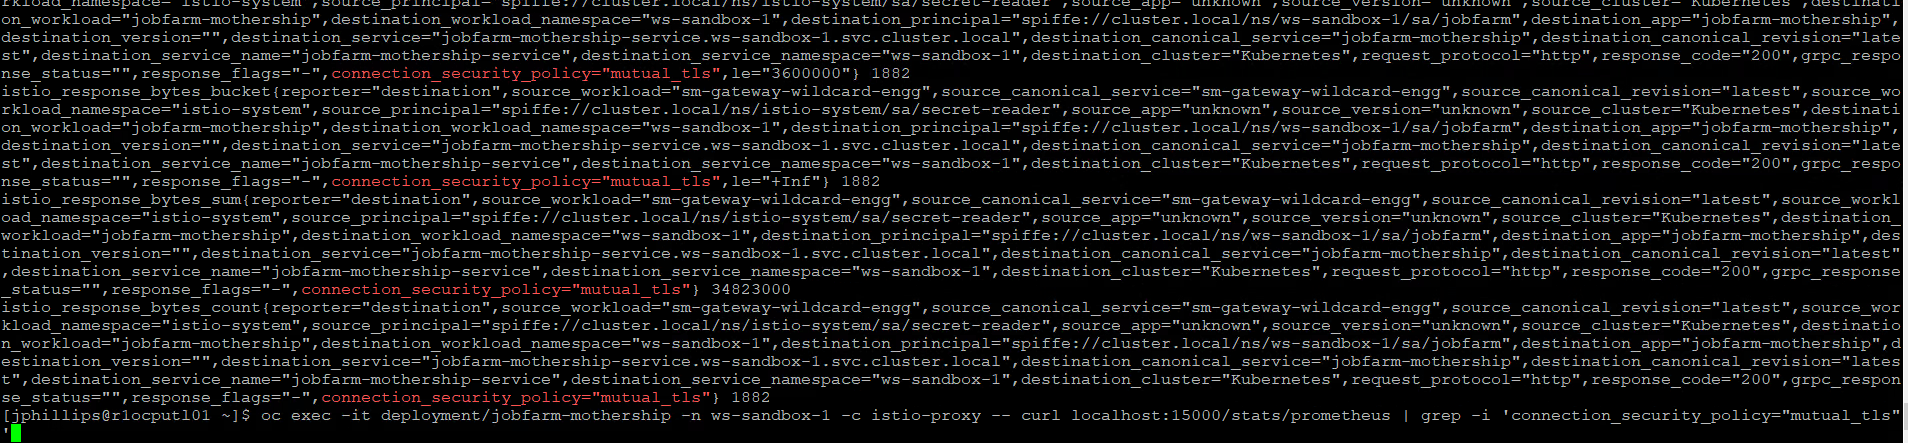
Confirmed MTLS traffic IS configured properly and is flowing (visible internally in log output at gateway and endpoints) confirmed security is enabled but cannot be visualized.
This visualization aspect is required for security guidance and demonstration for stakeholders and is high impact for the customer while unable to get loaded.
Data samples, screenshots, data and case links available in first comments after this issue is filed. Sensitive data omitted from case submission.