-
Bug
-
Resolution: Unresolved
-
 Major
Major
-
rhos-18.0.14 FR 4
-
None
-
0
-
False
-
-
False
-
?
-
python-taskflow-5.1.1-18.0.20260212134941.78aa34f.el9ost
-
rhos-workloads-evolution
-
None
-
Release Note Not Required
-
-
-
-
Important
We are performing a post adoption RHEL minor upgrade (9.2 to 9.4) on an OpenStack environment with 250+ nodes and approximately 10,000+ VMs. So, we are using Watcher's zone_migration strategy for planned hardware maintenance.
We intended to use zone_migration strategy for:
- Evacuate compute nodes in batches (50 nodes per batch)
- Migrate ~2500 VMs in a batch to buffer nodes(using multiple audits)
- Upgrade RHEL and migrate VMs back.
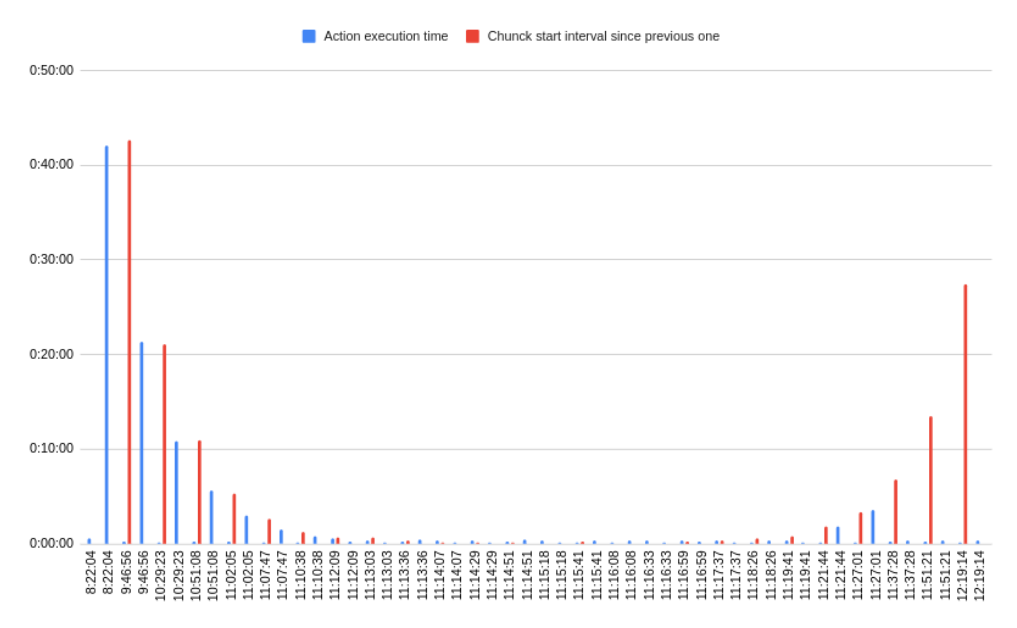
During the testing of zone_migration strategy for live migrations of VMs for compute node evacuation, we observed significant performance drop that may be a bottleneck for large scale migrations. Our test with 52 VMs in a single audit/actionplan took approximately 4 hours, which is actually expected to take ~30 - 60min using Nova CLI when migration is performed serially(with concurrency nova will take much less time).
Command that was used for an audit creation:
// Audit creation
time openstack optimize audit create -a WatcherBufferEvacuation -t ONESHOT -p compute_nodes='[{"src_node":"computer660-0.redhat.local", "dst_node":"computer660-66.redhat.local"}]' -p parallel_total=2500 -p parallel_per_node=100 -p with_attached_volume=true --name trial-0-to-buffer-66-test

// Note: Although large values like 2500 & 100 are passed to parallel_total and parallel_per_node, I believe that they are not the source of this performance degradation. They are just used for hard limits on the number of actions that can be part of an actionplan.
Actionplan:
sh-5.1$ openstack optimize actionplan list | grep -i 53cbeda6-c4c4-47e0-8394-256a0549bde1
| 53cbeda6-c4c4-47e0-8394-256a0549bde1 | b256429f-f2fe-457b-a164-6d529a7f3cd4 | SUCCEEDED | 2026-01-17T12:19:35+00:00 | Live_instance_migrate_ratio: 100.00 % |
sh-5.1$
Actions list:
sh-5.1$ openstack optimize action list --action-plan 53cbeda6-c4c4-47e0-8394-256a0549bde1 | head -7
+--------------------------------------+----------------------------------------------------------------------------------+-----------+--------------------------------------+---------+
| UUID                                 | Parents                                                                          | State     | Action Plan                          | Action  |
+--------------------------------------+----------------------------------------------------------------------------------+-----------+--------------------------------------+---------+
| 4949bdf3-4cdd-44da-95e5-8ffe2fd1427b | []                                                                               | SUCCEEDED | 53cbeda6-c4c4-47e0-8394-256a0549bde1 | migrate |
| 3973b9a4-f3f7-45a7-84fe-500972e1b6c5 | []                                                                               | SUCCEEDED | 53cbeda6-c4c4-47e0-8394-256a0549bde1 | migrate |
| 98cd7236-1b62-4934-89b4-0c218af880d0 | ['4949bdf3-4cdd-44da-95e5-8ffe2fd1427b', '3973b9a4-f3f7-45a7-84fe-500972e1b6c5'] | SUCCEEDED | 53cbeda6-c4c4-47e0-8394-256a0549bde1 | migrate |
| f3e1680e-0645-46bc-a974-85bcb2dfa72a | ['4949bdf3-4cdd-44da-95e5-8ffe2fd1427b', '3973b9a4-f3f7-45a7-84fe-500972e1b6c5'] | SUCCEEDED | 53cbeda6-c4c4-47e0-8394-256a0549bde1 | migrate |


sh-5.1$ openstack optimize action list --action-plan 53cbeda6-c4c4-47e0-8394-256a0549bde1 | grep -i succeeded | wc -l
52
So, here in this audit/actionplan... migrations happen from source compute "computer660-0.redhat.local" to destination "computer660-66.redhat.local".
Number of VMs being migrated: 52.
Time taken for the completion of all actions in an actionplan: ~14457 seconds.
[root@e18-h18-000-r660 ~]# PLAN_UUID=53cbeda6-c4c4-47e0-8394-256a0549bde1
[root@e18-h18-000-r660 ~]# START=$(oc exec -n openstack openstackclient -- openstack optimize actionplan show $PLAN_UUID -f value -c "Created At")
[root@e18-h18-000-r660 ~]# END=$(oc exec -n openstack openstackclient -- openstack optimize actionplan show $PLAN_UUID -f value -c "Updated At")
[root@e18-h18-000-r660 ~]# ELAPSED=$(( $(date -d "$END" +%s) - $(date -d "$START" +%s) ))
[root@e18-h18-000-r660 ~]# echo $ELAPSED
14457

// We have also measured the time using a script that monitors this actionplan which reported "14256" seconds.
Cpu and Memory usage of Watcher during and after the migration:
// during migration watcher applier using ~1 core cpu
[root@e18-h18-000-r660 ~]# oc adm top pod | grep -i watcher
watcher-api-0                   14m          292Mi
watcher-applier-0               997m         251Mi
watcher-decision-engine-0       71m          237Mi

// after migration
[root@e18-h18-000-r660 ~]# oc adm top pod | grep -i watcher
watcher-api-0                   3m           292Mi
watcher-applier-0               2m           251Mi
watcher-decision-engine-0       1m           235Mi
RHOSO version:
[root@e18-h18-000-r660 ~]# oc get openstackversion
NAME        TARGET VERSION            AVAILABLE VERSION         DEPLOYED VERSION
openstack   18.0.15-20251126.192455   18.0.15-20251126.192455   18.0.15-20251126.192455
Watcher status:
[root@e18-h18-000-r660 ~]# oc get watcher
NAME      STATUS   MESSAGE
watcher   True     Setup complete
I’ll share additional information and logs in the comments to keep this description concise.
- impacts account
-
OSPRH-1419 RHOSP 17.1 to RHOSO 18.0 Upgrade Using Adoption Mechanism with Live Workloads and Compute Node Rotation using Optimize Service (Watcher)
-

- In Progress
-
- relates to
-
RHOSSTRAT-1132 Watcher on scale
-

- In Progress
-


