-
Bug
-
Resolution: Done
-
 Minor
Minor
-
None
-
False
-
False
-
0
-
Undefined
-
Not Supported
-
ODC Sprint 217, ODC Sprint 218
-
Low
Description of problem:
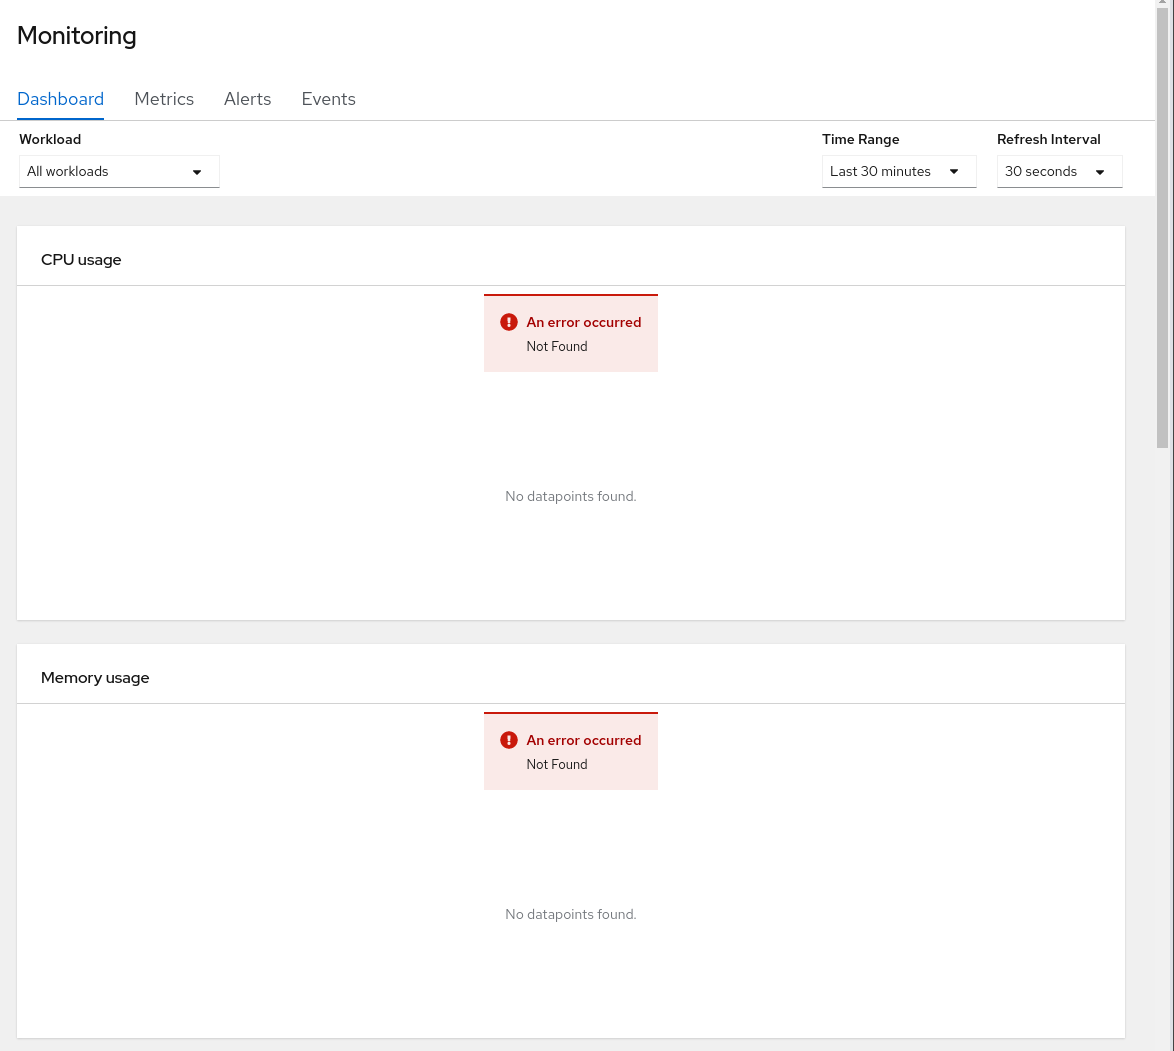
On a local cluster (CRC) monitoring is not available by default. The "Monitoring" entry in the developer perspective just show eight errors instead of charts. See attached screenshot.
The Monitoring navigation entry in the admin perspective is not shown.
Prerequisites (if any, like setup, operators/versions):
- CRC vs cluster setup
Steps to Reproduce
- Install and start a CRC
- Open developer console > Monitoring
Actual results:
Errors are shown
Expected results:
Monitoring navigation item is not available.
Reproducibility (Always/Intermittent/Only Once):
Always
Build Details:
4.7 / 4.8
Additional info:
On a CRC without installed monitoring the SERVER_FLAGS "alertManagerPublicURL", "grafanaPublicURL", "prometheusPublicURL" and "thanosPublicURL" are not available