-
Outcome
-
Resolution: Unresolved
-
 Undefined
-
None
-
None
-
None
-
Product / Portfolio Work
-
False
-
False
-
Not Set
-
No
-
Not Set
-
Not Set
-
Not Set
-
0% To Do, 0% In Progress, 100% Done
-
Undefined
Description
In recent years, Red Hat has put a lot of investment into their products to move them into this new Hybrid Cloud world. Hybrid Cloud describes the use of a wide variety of infrastructure combinations to which applications can be deployed. It goes away from the traditional "only-on-premise" or "only-cloud" and provides businesses with greater flexibility by moving applications between cloud, or on-premise, solutions as needs and costs fluctuate.
Additionally, Kubernetes made it way easier now to break up old, legacy monolithic application into smaller microservices and although they surely have their benefit, they also introduce yet another level of complexity. Organizations may end up with hundreds of services all communicating between each other which leads increase the number of failure scenarios and need special tools to avoid and/or fix.
Last but not least, new methodologies has emerged in the last years that force teams to rethink old approaches that became inadequate such as agile development methodologies, continues deployments, and new XOps (X in "Dev", "Sec", "Biz", and others) practices.
Customers, Red Hat SREs, either operation or application focused, administrators, and engineers all need the ability to observe the totality of a system for diagnosing and gaining insight into it. Irrespective of whether a component is a network, machine, microservice, or function, observability necessitates the signals’ output is meaningful and cohesive for understanding the internal workings.
Introducing Observability. Observability promises to help with these issues by introducing best practices and different tools which have been adapted and transformed into standalone platform solutions by Enterprise companies such as VMWare, Splunk, Elasti.co, IBM, and others. It goes beyond Monitoring and uses a wide variety of telemetry signals to enable end-to-end visibility across the entire stack from software to hardware. The key is to correlate all the collected information, with the goal of answering questions about the running system, assisting in resolving issues quickly (measured as Mean time To Resolution - MTTR) and/or optimizing the system.
Now let's take one step back and look at the possible signals that support the goal of Observability. Traditionally, people talk about the "Three Pillars of Observability": Logs, Traces, and Metrics.
- Logs: Immutable record of discrete events that happened over time. Usually represented either as plain-text (unstructured), structured (e.g. JSON), and binary (e.g. systemd journal logs).
- Metrics: Numbers describing a particular process or activity measured over intervals of time (e.g. a time series).
- Traces: Tree of data points (spans), each representing an event, scoped to a request.
Logs and metrics have been measured for decades, but traces is a fairly new concept that emerged as modern applications increasingly are built using distributed microservices. More recently, people realize that there shouldn't be boundaries or "Three Pillars" and Observability should be really about any information (e.g. profiling). Therefore, it is important to break out of this mantra and focus on expanding our ability to collect, expose, and correlate any available data.
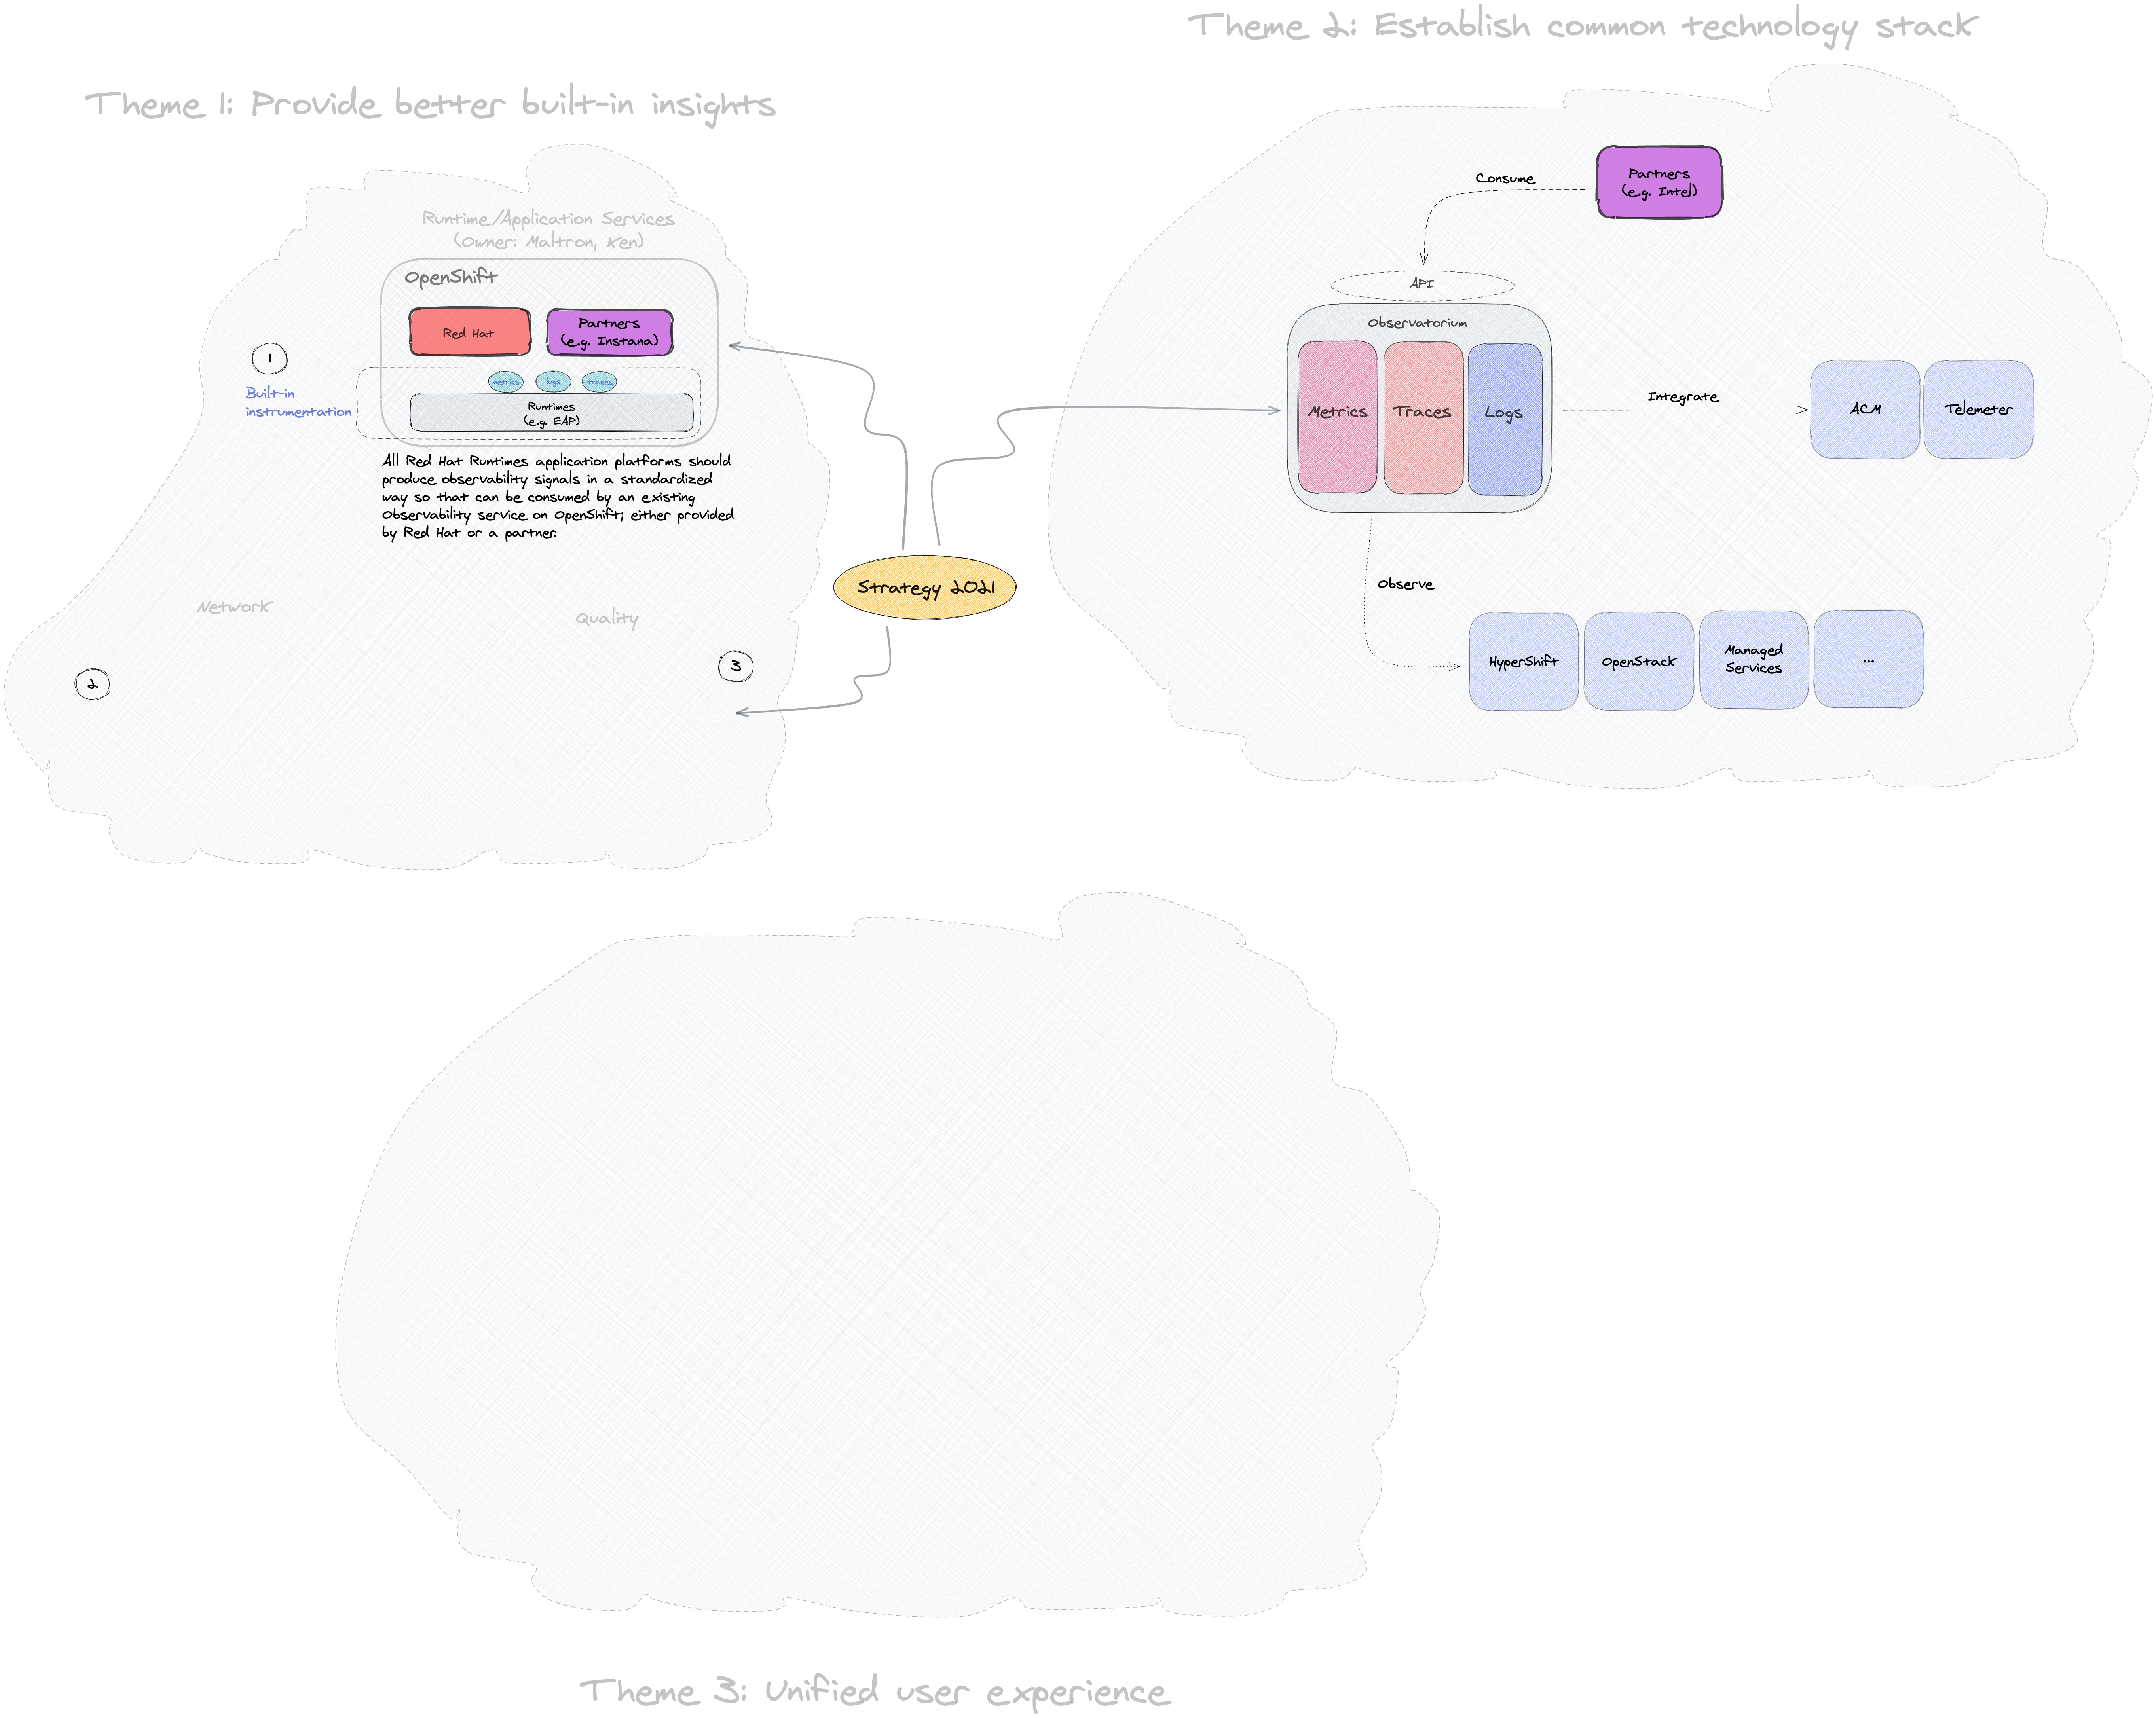
In summary, Observability is truly about consolidating any usable information by properly instrumenting systems, deriving actionable insights from them, and optimizing your system to avoid any, for example, extended outages (below figures highlights the important themes again). A unified and consistent observability experience is core to any successful Open Hybrid Cloud deployment.
Why it Matters
- Red Hat's focuses a lot of efforts on a more Open Hybrid Cloud strategy to grow our “share of voice” as the hybrid cloud technology leader. In a "Hybrid Cloud" ecosystem, you may have a very diverse environment and your workload needs to move seamlessly between them, putting much more pressure on infrastructure owners, as well as application owners, to operate a more complex ecosystem. Therefore, any infrastructure owner need a consistent approach for Observability to successfully operate in this more diverse world and consequently, Observability is a key success criteria for us to win this business.
- There is a lot of market interest and competitors seeing the potential as well, moving very quick either by acquisition and/or reframing their internal offerings around a more comprehensive Observability story.
- Growing internal needs, support our own SRE teams to “observe” their managed services offerings across different cloud vendors.
Features & Benefits
Observability is truly about consolidating any usable information by properly instrumenting systems, deriving actionable insights from them, and optimizing your system to avoid any, for example, extended outages. A unified and consistent observability experience is core to any successful Open Hybrid Cloud deployment. The following are key themes:
- Built-in Best Practices & Insights: Capturing and exposing observability data from anything provided by Red Hat running on top or underneath OpenShift; in a standardized way; as well as providing best practices on “How To”.
- Common Technology Stack: Providing a unified, scope-agnostic approach for Observability across the Red Hat product portfolio and easy integration for partners to add additional value to our core capabilities.
- Unified User Experience: Presenting data meaningful back to consumers by correlating observability signals seamlessly to improve the Mean-Time-To-Resolution significantly.
Illustrative User Stories or Scenarios
- As an SRE, I would like the ability to see and explore other observability signals from an alert I received to avoid having to log into multiple system so that I can jump start my investigation and solve problems quicker.
Expected Outcomes
Glossary/Terms
- Monitoring: Best suited to reporting the overall health of a system. Limit to key business and system metrics, and known failure modes. Symptom-based alerting. “What’s broken?” and “Why?”. “Reactive” approach to diagnosis. Reacting to alerts “Is the system working?”.
- Observability: Enabling complete end-to-end visibility into your applications, systems, APIs, microservices, network, infrastructure, and more. “Proactive” approach to diagnosing and understanding a system.
- Signals: Piece of data collected from an application. Examples include Metrics, Logs, Traces.
