-
Bug
-
Resolution: Obsolete
-
 Undefined
-
None
-
4.9.z
-
None
-
Quality / Stability / Reliability
-
False
-
-
None
-
None
-
None
-
None
-
None
-
None
-
None
-
None
-
None
-
None
-
None
-
None
-
None
-
None
Description of problem:
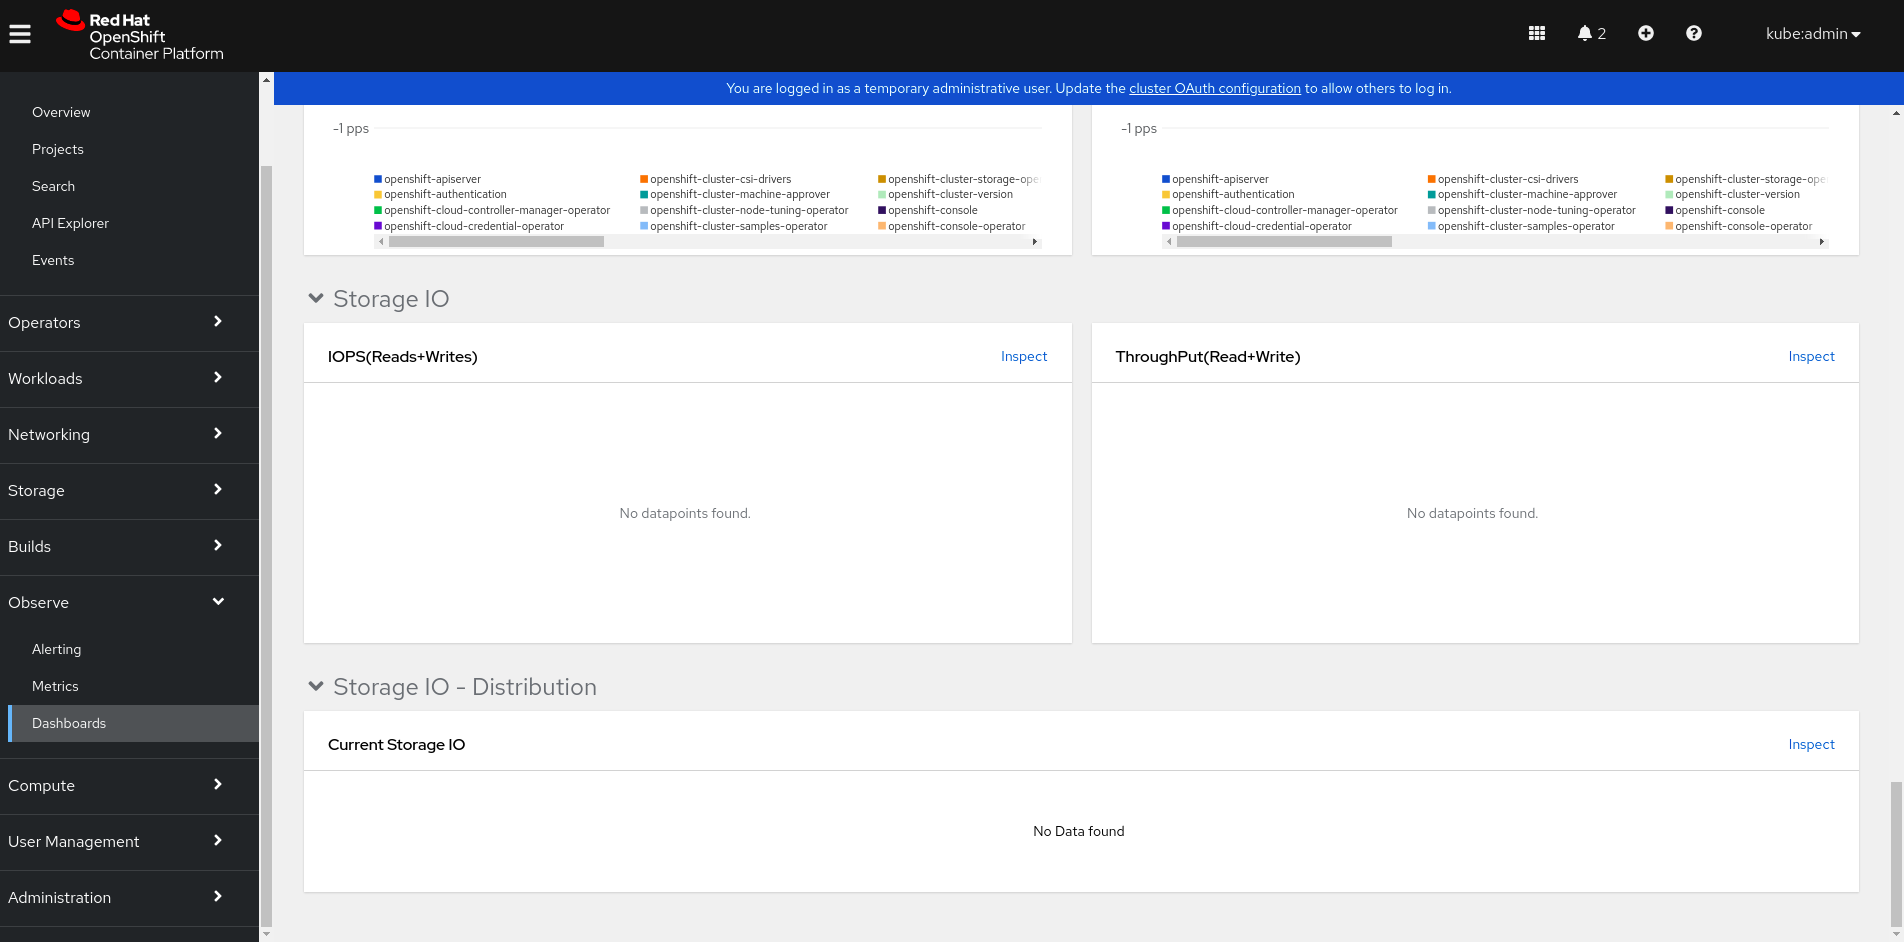
same as OCPBUGS-2623, the issue also exist in 4.9, "Storage IO" graphs show "No datapoints found.", affected dashboards
"Kubernetes / Compute Resources / Cluster" dashboard
"Kubernetes / Compute Resources / Namespace (Pods)" dashboard
"Kubernetes / Compute Resources / Pod" dashboard
see the prometheus expression for the affected dashboards
a. "Kubernetes / Compute Resources / Cluster" dashboard
Storage IO
IOPS(Reads+Writes) expression:
ceil(sum by(namespace) (rate(container_fs_reads_total{container!="", cluster=""}[5m]) + rate(container_fs_writes_total{container!="", cluster=""}[5m])))

ThroughPut(Read+Write) expression:
sum by(namespace) (rate(container_fs_reads_bytes_total{container!="", cluster=""}[5m]) + rate(container_fs_writes_bytes_total{container!="", cluster=""}[5m]))

Storage IO - Distribution
Current Storage IO expression:
1. sum by(namespace) (rate(container_fs_reads_total{container!="", cluster=""}[5m]))
2. sum by(namespace) (rate(container_fs_writes_total{container!="", cluster=""}[5m]))
3. sum by(namespace) (rate(container_fs_reads_total{container!="", cluster=""}[5m]) + rate(container_fs_writes_total{container!="", cluster=""}[5m]))
4. sum by(namespace) (rate(container_fs_reads_bytes_total{container!="", cluster=""}[5m]))
5. sum by(namespace) (rate(container_fs_writes_bytes_total{container!="", cluster=""}[5m]))
6. sum by(namespace) (rate(container_fs_reads_bytes_total{container!="", cluster=""}[5m]) + rate(container_fs_writes_bytes_total{container!="", cluster=""}[5m]))

b. "Kubernetes / Compute Resources / Namespace (Pods)" dashboard, selected openshift-apiserver in this bug
Storage IO
IOPS(Reads+Writes) expression:
ceil(sum by(pod) (rate(container_fs_reads_total{container!="", cluster="",namespace="openshift-apiserver"}[5m]) + rate(container_fs_writes_total{container!="", cluster="",namespace="openshift-apiserver"}[5m])))

ThroughPut(Read+Write) expression:
sum by(pod) (rate(container_fs_reads_bytes_total{container!="", cluster="",namespace="openshift-apiserver"}[5m]) + rate(container_fs_writes_bytes_total{container!="", cluster="",namespace="openshift-apiserver"}[5m]))

Storage IO - Distribution
Current Storage IO expression:
1. sum by(pod) (rate(container_fs_reads_total{container!="", cluster="",namespace="openshift-apiserver"}[5m]))
2. sum by(pod) (rate(container_fs_writes_total{container!="", cluster="",namespace="openshift-apiserver"}[5m]))
3. sum by(pod) (rate(container_fs_reads_total{container!="", cluster="",namespace="openshift-apiserver"}[5m]) + rate(container_fs_writes_total{container!="", cluster="",namespace="openshift-apiserver"}[5m]))
4. sum by(pod) (rate(container_fs_reads_bytes_total{container!="", cluster="",namespace="openshift-apiserver"}[5m]))
5. sum by(pod) (rate(container_fs_writes_bytes_total{container!="", cluster="",namespace="openshift-apiserver"}[5m]))
6. sum by(pod) (rate(container_fs_reads_bytes_total{container!="", cluster="",namespace="openshift-apiserver"}[5m]) + rate(container_fs_writes_bytes_total{container!="", cluster="",namespace="openshift-apiserver"}[5m]))

c. "Kubernetes / Compute Resources / Pod" dashboard, selected one pod from openshift-apiserver in this bug
Storage IO - Distribution(Containers)
IOPS(Reads+Writes) expression:
ceil(sum by(container) (rate(container_fs_reads_total{container!="", cluster="",namespace="openshift-apiserver", pod="apiserver-5d6c8bbbc8-2hwwj"}[5m]) + rate(container_fs_writes_total{container!="", cluster="",namespace="openshift-apiserver", pod="apiserver-5d6c8bbbc8-2hwwj"}[5m])))

ThroughPut(Read+Write) expression:
sum by(container) (rate(container_fs_reads_bytes_total{container!="", cluster="",namespace="openshift-apiserver", pod="apiserver-5d6c8bbbc8-2hwwj"}[5m]) + rate(container_fs_writes_bytes_total{container!="", cluster="",namespace="openshift-apiserver", pod="apiserver-5d6c8bbbc8-2hwwj"}[5m]))

Storage IO - Distribution
Current Storage IO expression:
1. sum by(container) (rate(container_fs_reads_total{container!="", cluster="",namespace="openshift-apiserver", pod="apiserver-5d6c8bbbc8-2hwwj"}[5m]))
2. sum by(container) (rate(container_fs_writes_total{container!="", cluster="",namespace="openshift-apiserver", pod="apiserver-5d6c8bbbc8-2hwwj"}[5m]))
3. sum by(container) (rate(container_fs_reads_total{container!="", cluster="",namespace="openshift-apiserver", pod="apiserver-5d6c8bbbc8-2hwwj"}[5m]) + rate(container_fs_writes_total{container!="", cluster="",namespace="openshift-apiserver", pod="apiserver-5d6c8bbbc8-2hwwj"}[5m]))
4. sum by(container) (rate(container_fs_reads_bytes_total{container!="", cluster="",namespace="openshift-apiserver", pod="apiserver-5d6c8bbbc8-2hwwj"}[5m]))
5. sum by(container) (rate(container_fs_writes_bytes_total{container!="", cluster="",namespace="openshift-apiserver", pod="apiserver-5d6c8bbbc8-2hwwj"}[5m]))
6. sum by(container) (rate(container_fs_reads_bytes_total{container!="", cluster="",namespace="openshift-apiserver", pod="apiserver-5d6c8bbbc8-2hwwj"}[5m]) + rate(container_fs_writes_bytes_total{container!="", cluster="",namespace="openshift-apiserver", pod="apiserver-5d6c8bbbc8-2hwwj"}[5m]))
reason is in 4.9, container label for container_fs_.* metrics is dropped,
$ oc -n openshift-monitoring get servicemonitor kubelet -oyaml
...
    - action: drop
      regex: ;(container_fs_.*);.+
      sourceLabels:
      - __tmp_keep_metric
      - __name__
      - container
example
$ token=`oc sa get-token prometheus-k8s -n openshift-monitoring`
$ oc -n openshift-monitoring exec -c prometheus prometheus-k8s-0 -- curl -k -H "Authorization: Bearer $token" 'https://prometheus-k8s.openshift-monitoring.svc:9091/api/v1/query?query=container_fs_reads_bytes_total' | jq
....
      {
        "metric": {
          "__name__": "container_fs_reads_bytes_total",
          "device": "/dev/nvme0n1",
          "endpoint": "https-metrics",
          "id": "/system.slice/systemd-udevd.service",
          "instance": "10.0.204.243:10250",
          "job": "kubelet",
          "metrics_path": "/metrics/cadvisor",
          "node": "ip-10-0-204-243.us-east-2.compute.internal",
          "service": "kubelet"
        },
        "value": [
          1672995939.851,
          "7093760"
        ]
      },
Version-Release number of selected component (if applicable):
4.9.0-0.nightly-2023-01-03-103749
How reproducible:
always
Steps to Reproduce:
1. check monitoring dashboards
2.
3.
Actual results:
Metrics section for resource consumption are not visible and shows as datapoints not found.
Expected results:
show result
Additional info: