-
Bug
-
Resolution: Done
-
 Critical
-
4.19.0
-
Quality / Stability / Reliability
-
False
-
-
None
-
Low
-
None
-
None
-
Proposed
-
None
-
In Progress
-
Release Note Not Required
-
None
-
None
-
None
-
None
-
None
(Feel free to update this bug's summary to be more specific.)
Component Readiness has found a potential regression in the following test:
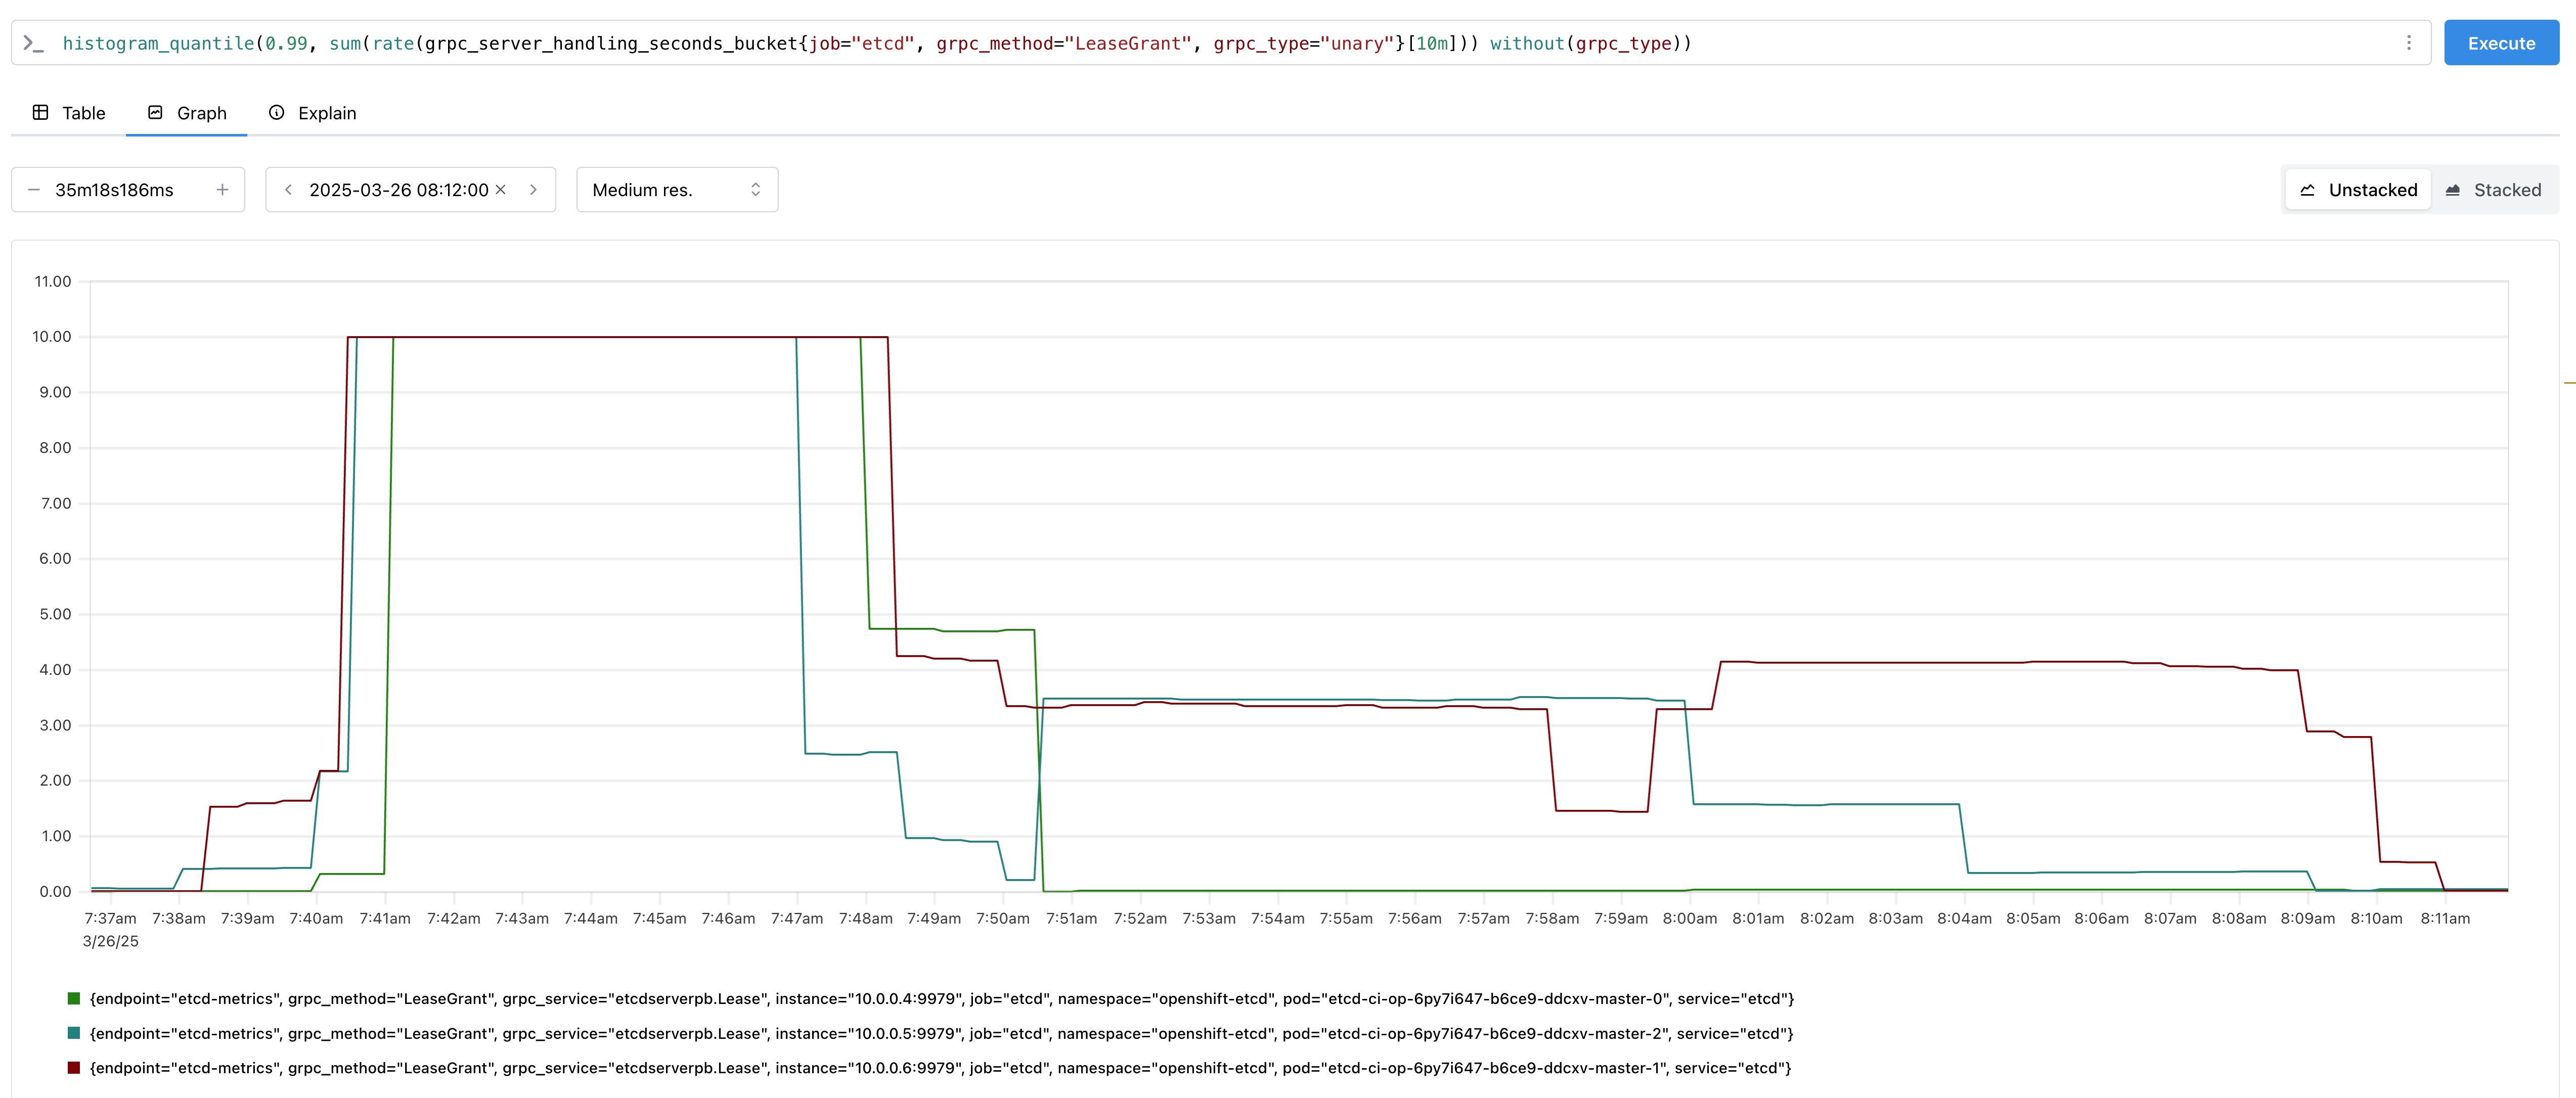
[bz-etcd][invariant] alert/etcdGRPCRequestsSlow should not be at or above info
No significant regressions found
Sample (being evaluated) Release: 4.19
Start Time: 2025-03-11T00:00:00Z
End Time: 2025-03-25T16:00:00Z
Success Rate: 93.86%
Successes: 443
Failures: 29
Flakes: 0
Base (historical) Release: 4.17
Start Time: 2025-02-25T00:00:00Z
End Time: 2025-03-25T16:00:00Z
Success Rate: 93.68%
Successes: 89
Failures: 6
Flakes: 0
View the test details report for additional context.
This regression has been around for 18 days. However this is an extremely difficult regression to process. We're comparing against 4.17 and 4.18 month prior to GA, 4.17 shows up as the best pass rate, so we get marked regressed against that. As of today 4.17 GA was 99% passing, 4.18 GA was 96%, and 4.19 is currently 93%.
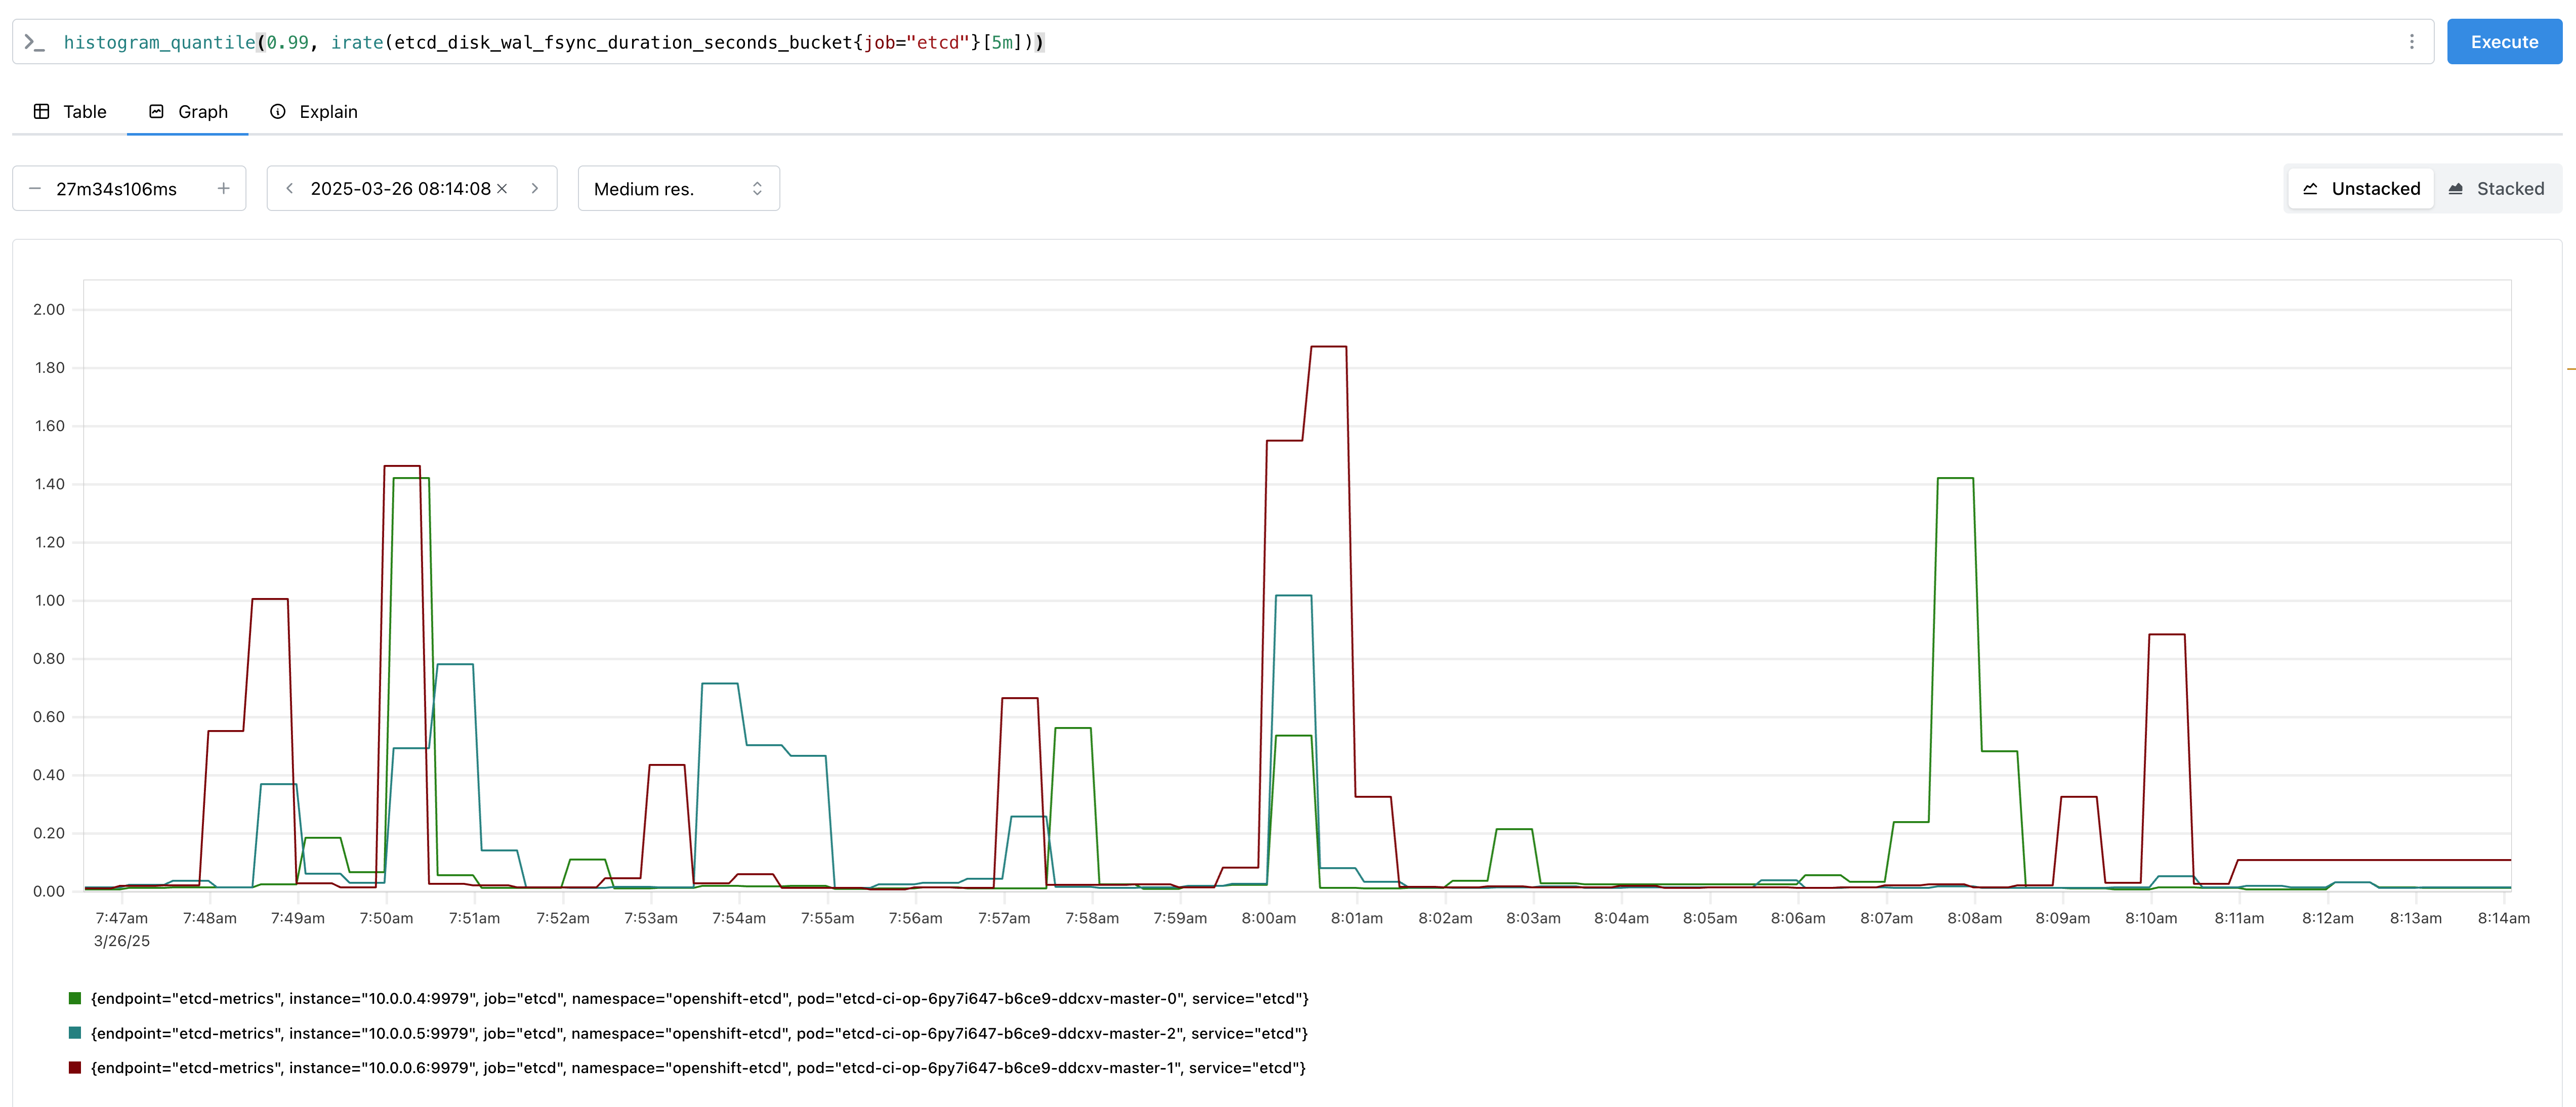
But when we're talking about what is suspected to be azure disks, comparing to a GA window is not always ideal as we cannot assume cloud disks are performing as they were back then. Perhaps more interestingly we could compare the last month of 4.17 vs the last month of 4.19, now we're at 94% vs 94% and the picture is getting clearer. Either the disk performance is not predictable months later, or a regression has made it into the product and all the way back to 4.17.
But the test passing is based on a very coarse and forgiving threshold, is the data actually showing things got worse? After some fixes this morning the alert monitoring dashboard is live again and as you can see, the question of "are we worse" all depends on the day you ask it. Today, definitely we look worse than both 4.17 and 4.18. If you asked on March 1st, 4.19 was 3x as bad as it is today, and 4.17 was twice as bad as that yet again. For totally unknown reasons, 4.18 seems dramatically lower than both most of the time.
The P90 appears to be 0 for all, so whatever happens is about one run in 20 appearing at our P95. The alert can fire for a very long time, up to 1000 seconds. It happens during node upgrades, it happens during conformance. For some reason it hits minor upgrades far far worse than micros (p95 consistently 0), but this may be because we have very little data for that combo. My guess would be that this implicates the problem most frequently occurs when nodes are updating. (which would be much less common in micro upgrades)
Methodology for uncovering is to view the job runs this test fails in, or listed in the dashboard link above.
- Open prow jobs and use Debug Tools > Intervals.
- Select the right intervals file if needed there may be two spyglass intervals files, one for upgrade and one for conformance.
- Check override display flag (alert intervals seem not to set it, fix incoming today).
- Scroll to the alerts section and you should see the grpc alert firing, and be able to correlate with what else was going on in the cluster.
- blocks
-
-

- Closed
-
- is cloned by
-
-
- Closed
-
- relates to
-
-
- Closed
-
-
-

- Closed
-
- links to

