-
Bug
-
Resolution: Duplicate
-
 Major
Major
-
None
-
4.19.0
-
Quality / Stability / Reliability
-
False
-
-
None
-
None
-
None
-
None
-
None
-
Approved
-
None
-
None
-
None
-
None
-
None
-
None
-
None
-
None
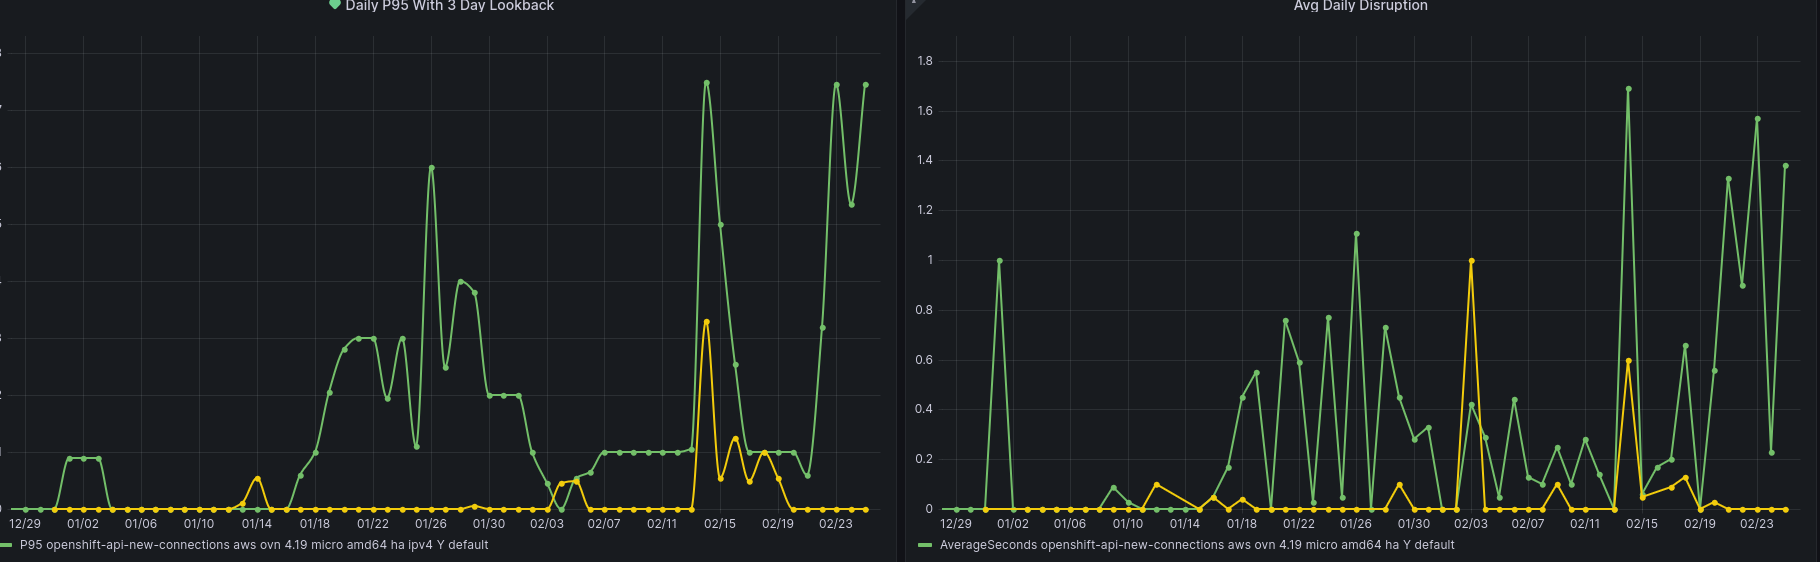
Beginning around 1/15 an increase in disruption has been detected across openshift-api backends.
This frequently happens during conformance testing after any upgrade has completed as seen in 4.19-e2e-aws-ovn-upgrade/1879411183967014912 - This job upgrades to `release:4.19.0-0.nightly-2025-01-15-060507` and at the moment is the earliest detection of the pattern described here.
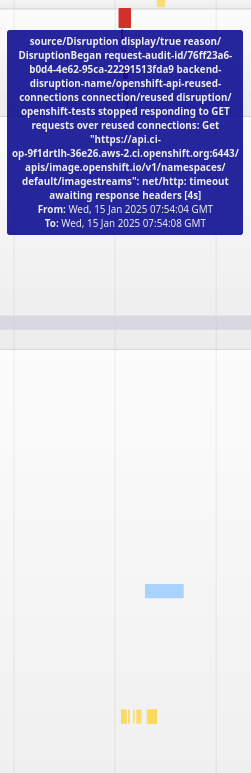
Disruption is shown in the conformance intervals - spyglass_20250115-075108:
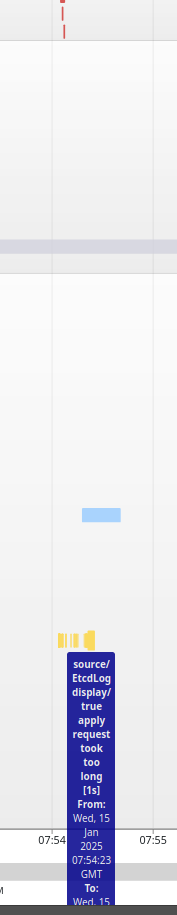
Additionally at the same time in the intervals are pod log entries for etcd indicating 'apply request took too long':
In the event-filter at that time (07:54 in this case) we see ProbeError and Unhealthy event reasons for openshift-kube-apiserver / openshift-apiserver.
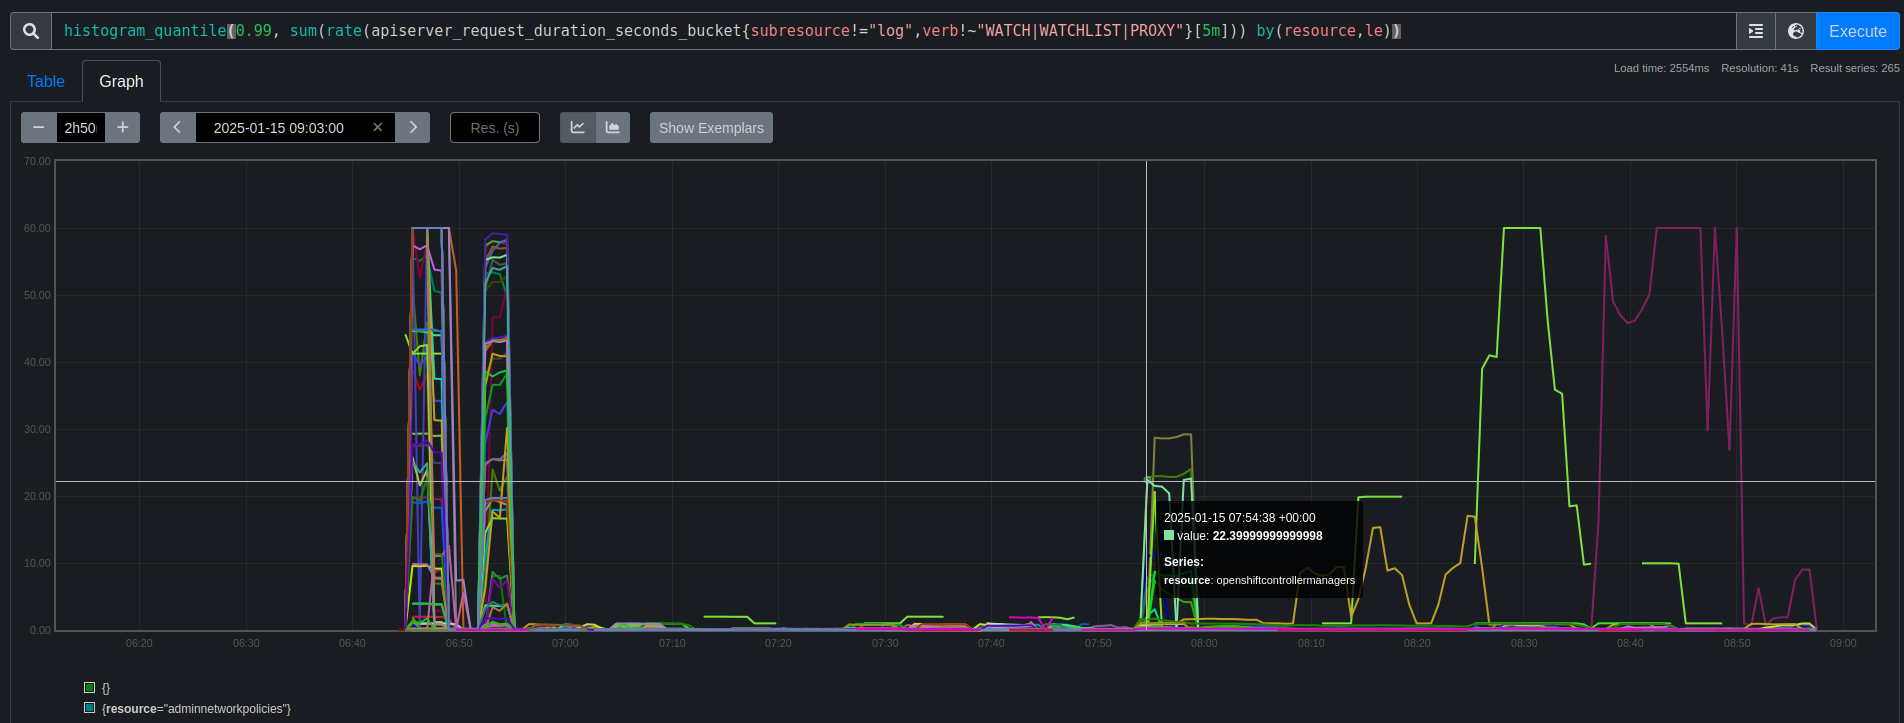
Looking at PromeCIeus using
histogram_quantile(0.99, sum(rate(apiserver_request_duration_seconds_bucket{subresource!="log",verb!~"WATCH|WATCHLIST|PROXY"}[5m])) by(resource,le))
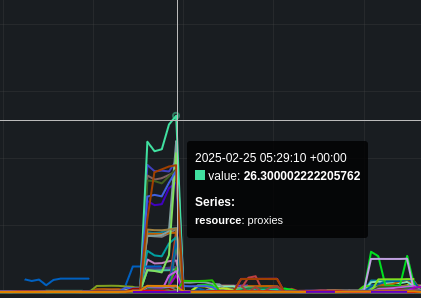
we can see the request duration spike for a number of resources at that time:
Reviewing backend-disruption_20250115-075108.json and selecting the request-audit-id for one of the failures like:
"Jan 15 07:54:04.483 - 999ms E backend-disruption-name/kube-api-reused-connections connection/reused disruption/openshift-tests reason/DisruptionBegan request-audit-id/6a2233a6-4f0f-435a-b11d-132185f218bf backend-disruption-name/kube-api-reused-connections connection/reused disruption/openshift-tests stopped responding to GET requests over reused connections: Get \"https://api.ci-op-9f1drtlh-36e26.aws-2.ci.openshift.org:6443/api/v1/namespaces/default\": net/http: timeout awaiting response headers",
we can locate that entry in the audit logs and see the latency appears to be with etcd
"auditID":"6a2233a6-4f0f-435a-b11d-132185f218bf"
"apiserver.latency.k8s.io/etcd":"16.000126231s"
"apiserver.latency.k8s.io/total":"16.006017506s"

"Failure","message":"context canceled","code":500
Looking to start this investigation with apiserver and potentially rit team though obviously understanding the cause of the etcd latency is key.


- is duplicated by
-
-

- Closed
-