-
Bug
-
Resolution: Not a Bug
-
Normal
-
None
-
4.14.z
-
Quality / Stability / Reliability
-
False
-
-
None
-
None
-
No
-
None
-
None
-
None
-
None
-
None
-
None
-
None
-
None
-
None
-
None
-
None
Description of problem:
As part of Hypershift perf&scale exercise, we run cluster-density workloads which are control-plane intensive as well as KAS, we measure latency metrics to understand their performances.
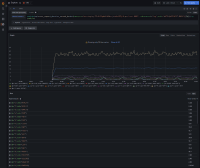
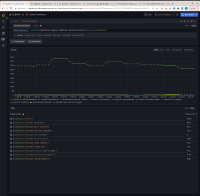
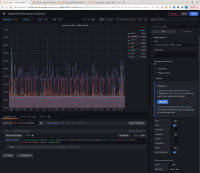
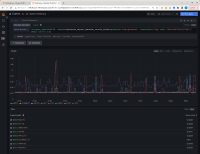
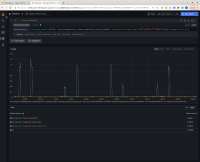
Surprisingly, the api latency metrics like all apiserver_request_duration_seconds_bucket are consistenlty at 990ms even during idle as well as during heavy operation. we suspect its not reporting a right state.

This is the query we used to record the linked snapshot,
histogram_quantile(0.99, sum(rate(apiserver_request_duration_seconds_bucket{namespace=~"$namespace",resource=~"$resource",subresource!="log",verb!~"WATCH|WATCHLIST|PROXY"}[2m])) by(verb,le))
Version-Release number of selected component (if applicable):
4.14.0-rc.6
How reproducible:
Always
Steps to Reproduce:
1. Deploy a HC
2. watch apiserver_request_duration_seconds_bucket
3. They are constant at 990ms
Actual results:
Latency is constant, although we see spikes during workload.
Expected results:
During idle we don't expect 990ms latency for GET, POST, PATHC, APPLY, DELETE calls
Additional info:
