-
Bug
-
Resolution: Done-Errata
-
Major
-
4.14
-
None
-
Quality / Stability / Reliability
-
False
-
-
None
-
None
-
Yes
-
None
-
None
-
None
-
None
-
None
-
None
-
None
-
None
-
None
-
None
Description of problem:
The Prometheus alerts will include a source link ("generatorURL") in their payload. This URL links to the management console and is used to display the metrics that triggered the alert.
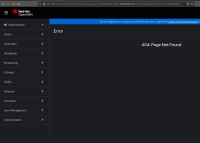
When clicking on the link from the Alertmanager UI, the console displays a 404 page.
Version-Release number of selected component (if applicable):
4.14 (but I didn't check if the same issue exists for previous versions)
How reproducible:
Always
Steps to Reproduce:
1. Install a cluster
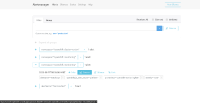
2. Open the list of alerts from the Alertmanager UI (using port-forward)
3. Click on the source link for the always firing Watchdog alert.
Actual results:
The console displays a 404 page.
Expected results:
The console displays the Observe > Metrics page with the alert's PromQL expression.
Additional info:

