-
Bug
-
Resolution: Unresolved
-
 Undefined
-
None
-
Logging 6.3, logging 6.4
-
False
-
-
False
-
-
-
Important
ISSUE 1. Position of this section
In Logging 6 was introduced the section: "Loki query performance troubleshooting" [0]. This section is inside "Configuring logging" [1] .
An user could not expect to find a "Troubleshooting section" inside a "Configuring section". In the past, it existed an specific section called "Trobleshooting logging" [2] that it was independent of the rest of the documentation and it's usually how it's observed in the most of the product docs.
H4. ISSUE 2. Not correct steps
In the section "Analyzing Loki query performance", it's said
"In the OpenShift Container Platform web console, navigate to the Metrics >
Observe tab"
This path does not exist and the metrics explained can be obtained in two different ways:
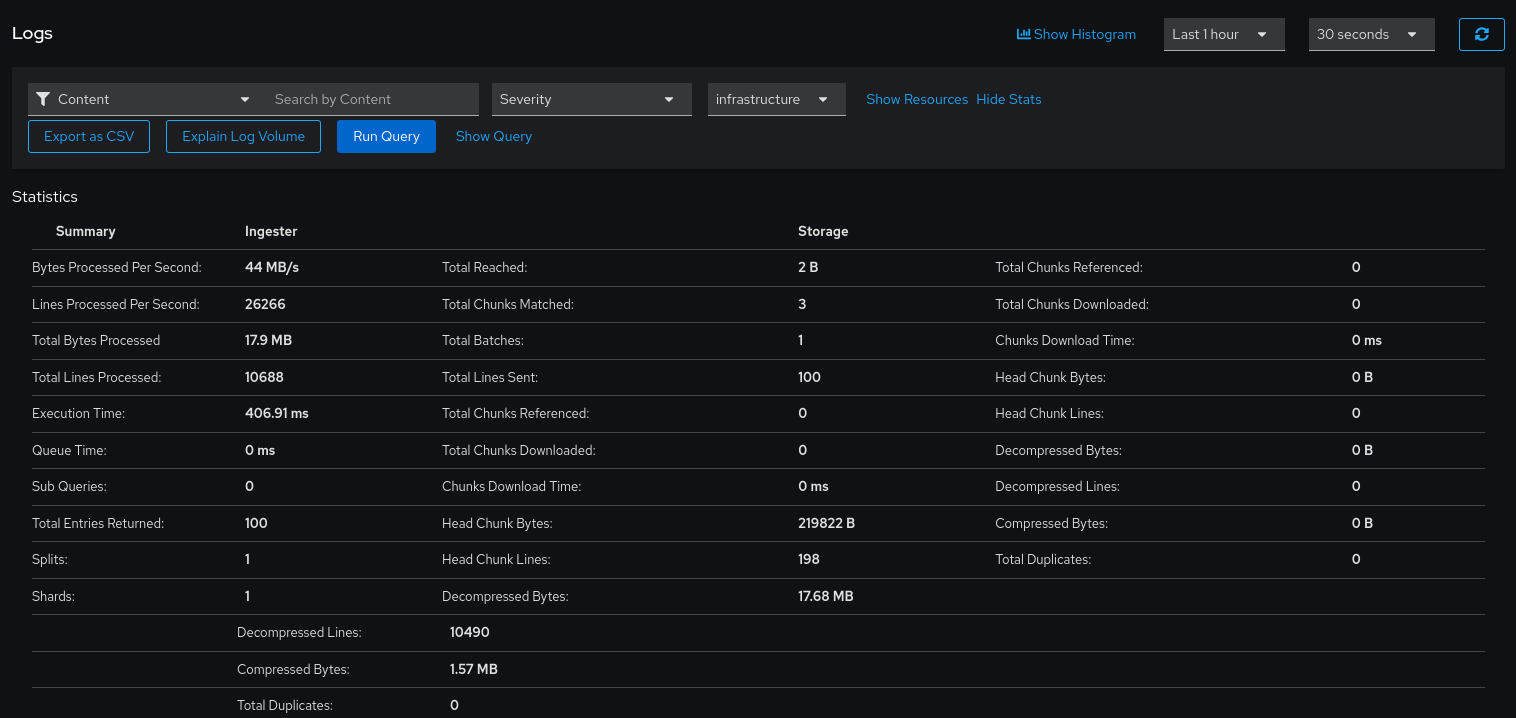
- if the query is successful
Go to the "OpenShift Console > Observe > Logs", run the query and once the result is obtained, press "Show Stats".
The "Show Stats" is present if the query is successful, else, this menu won't be visible
Other method of checking these metrics is from the Loki Querier pods or Loki Querier Frontend pods. See the explanation in how to check these metrics from when "if the query is not sucessful" valid also here.
- if the query is not sucessful
This means that the Loki Querier was not able to get all the chunks required from the query.
It's possible to see some of the metrics and the errors from the "logging-loki-querier" pods:
$
$ oc logs logging-loki-querier-756868cc5d-n4nt4
[...]
level=info ts=2026-02-04T08:50:18.714938547Z caller=metrics.go:237 component=querier org_id=infrastructure latency=fast query="{log_type=\"infrastructure\"} | json" query_hash=19108904 query_type=limited range_type=range length=9m42.068s start_delta=1h0m0.782920543s end_delta=50m18.714920683s step=14s duration=132.465173ms status=200 limit=100 returned_lines=0 throughput=0B total_bytes=0B total_bytes_structured_metadata=0B lines_per_second=0 total_lines=0 post_filter_lines=0 total_entries=0 store_chunks_download_time=0s queue_time=0s splits=0 shards=0 query_referenced_structured_metadata=false pipeline_wrapper_filtered_lines=0 chunk_refs_fetch_time=132.20239ms cache_chunk_req=0 cache_chunk_hit=0 cache_chunk_bytes_stored=0 cache_chunk_bytes_fetched=0 cache_chunk_download_time=0s cache_index_req=0 cache_index_hit=0 cache_index_download_time=0s cache_stats_results_req=0 cache_stats_results_hit=0 cache_stats_results_download_time=0s cache_volume_results_req=0 cache_volume_results_hit=0 cache_volume_results_download_time=0s cache_result_req=0 cache_result_hit=0 cache_result_download_time=0s cache_result_query_length_served=0s cardinality_estimate=0 ingester_chunk_refs=0 ingester_chunk_downloaded=0 ingester_chunk_matches=0 ingester_requests=1 ingester_chunk_head_bytes=0B ingester_chunk_compressed_bytes=0B ingester_chunk_decompressed_bytes=0B ingester_post_filter_lines=0 congestion_control_latency=0s index_total_chunks=0 index_post_bloom_filter_chunks=0 index_bloom_filter_ratio=0.00 index_used_bloom_filters=false index_shard_resolver_duration=0s disable_pipeline_wrappers=false has_labelfilter_before_parser=false
[0] https://docs.redhat.com/es/documentation/red_hat_openshift_logging/6.3/html/configuring_logging/loki-query-performance-troubleshooting_opentelemetry-data-model
[1] https://docs.redhat.com/es/documentation/red_hat_openshift_logging/6.3/html/configuring_logging/loki-query-performance-troubleshooting_opentelemetry-data-model
[2] https://docs.redhat.com/en/documentation/openshift_container_platform/4.14/html/logging/troubleshooting-logging
[3] https://docs.redhat.com/en/documentation/red_hat_openshift_logging/6.4/html/configuring_logging/loki-query-performance-troubleshooting_opentelemetry-data-model#analyzing-loki-query-performance_loki-query-performance-troubleshooting


