-
Feature
-
Resolution: Unresolved
-
Undefined
-
None
-
None
-
None
-
False
-
-
False
-
Not Selected
-
0
1. Proposed title of this feature request
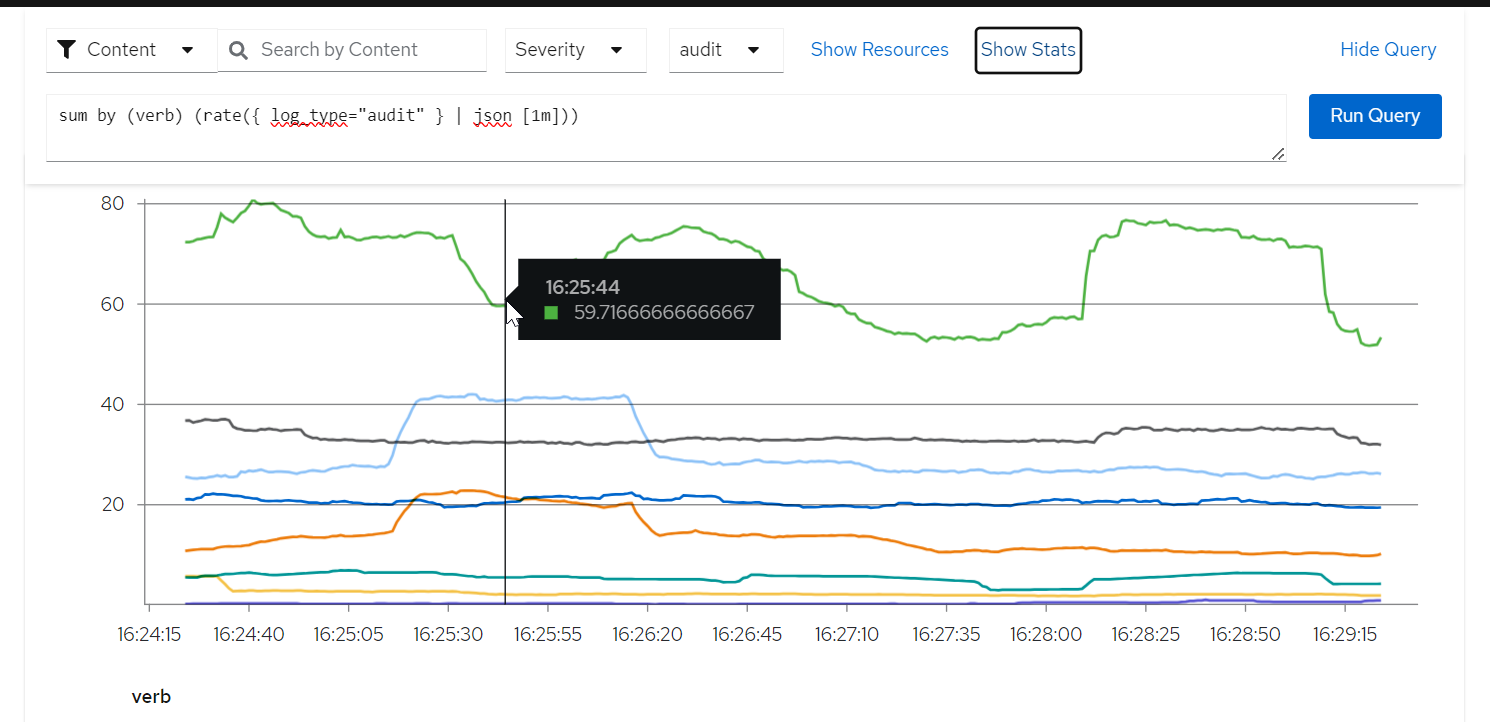
Show the label when hovering to the lines on the graph produced, when performing metric query.
2. What is the nature and description of the request?
The customer is requiring to add the label when hovering to the lines on the graph together with the values, for better reading the graphs. Legends are provided but for the customer it will be easier to read the graphs if the label shows when hovering on it, especially when the query is very big.
3. Why does the customer need this? (List the business requirements here)
To read the graph easier.
4. List any affected packages or components.

