-
Task
-
Resolution: Unresolved
-
Undefined
-
None
-
None
-
None
-
None
-
False
-
-
False
-
None
-
None
-
None
-
None
-
None
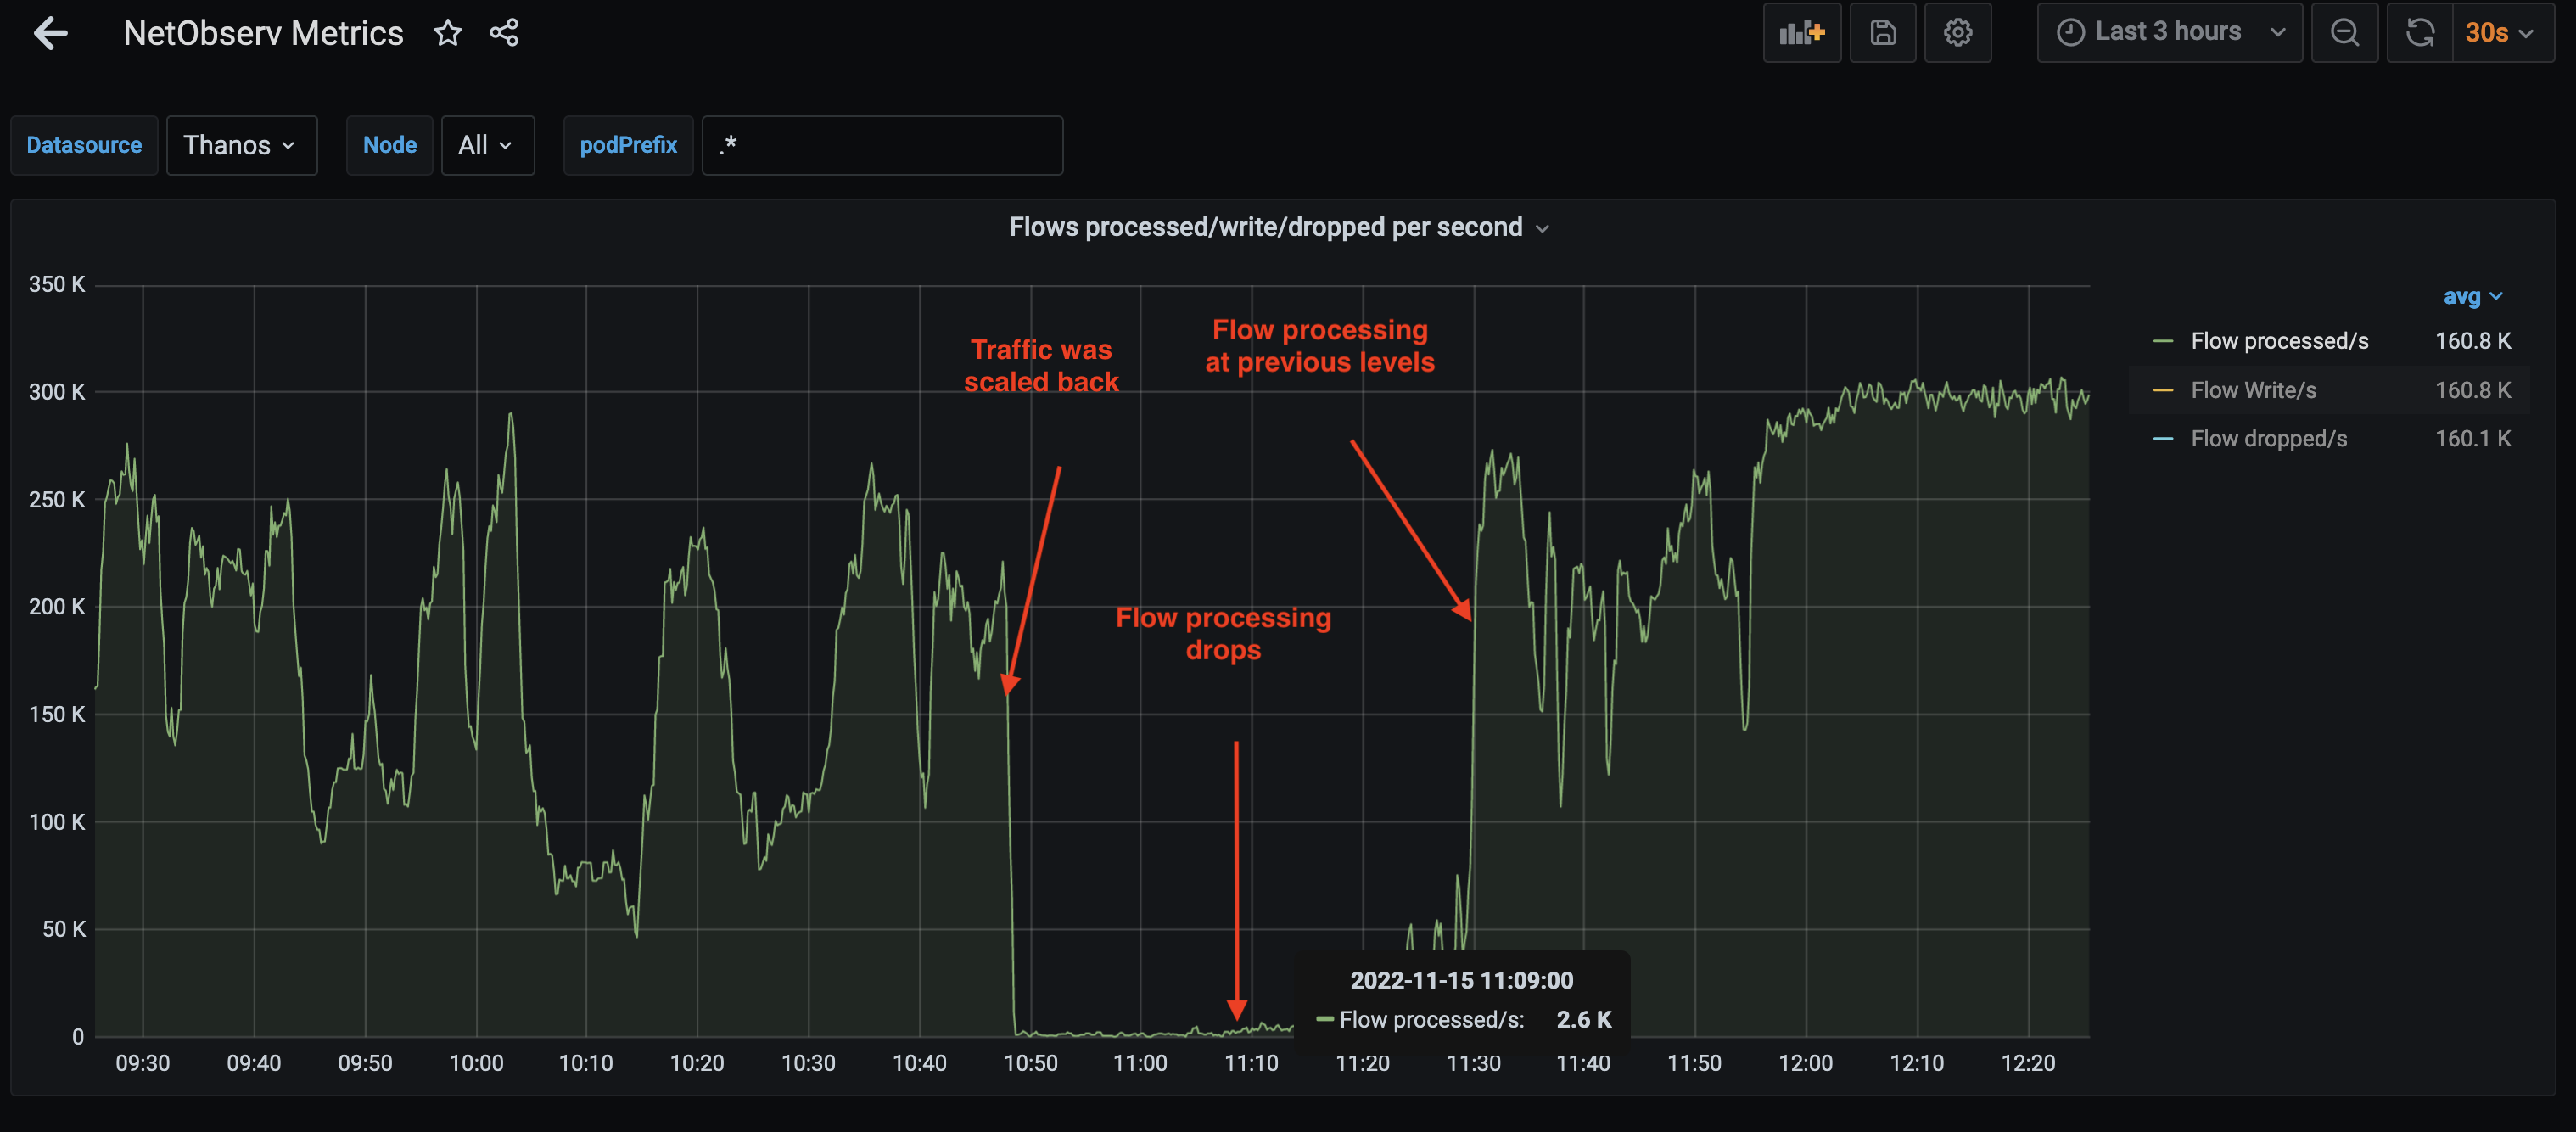
In a scale lab environment, when traffic was somewhat (not entirely) scaled back I noticed the Flow processing takes a very high drop going from around 200K/sec to 3K/sec. It comes back to previous levels on its own after about 45 mins. During this time I see lots of 429s from loki with below error:
time=2022-11-15T15:27:30Z level=info component=client error=server returned HTTP status 429 Too Many Requests (429): Maximum active stream limit exceeded, reduce the number of active streams (reduce labels or reduce label values), or contact your Loki administrator to see if the limit can be increased fields.level=warn fields.msg=error sending batch, will retry host=lokistack-distributor-http.openshift-operators-redhat.svc:3100 module=export/loki status=429

My probably theory for above behavior is - whether such drop is due to drop in "active" streams ingesting into Loki and flows processing resumes normally in about ~45 mins as it’s able to successfully ingest (new?) streams again in Loki.
Such behaviors could be caused if there are sudden changes in network traffic patterns.
- is caused by
-
NETOBSERV-483 Do performance testing for large cluster
-
- Closed
-