-
Epic
-
Resolution: Done
-
Critical
-
None
-
Pagination in NetFlow Table
-
To Do
-
Product / Portfolio Work
-
-
0% To Do, 0% In Progress, 100% Done
-
False
-
-
False
-
Not Selected
-
M
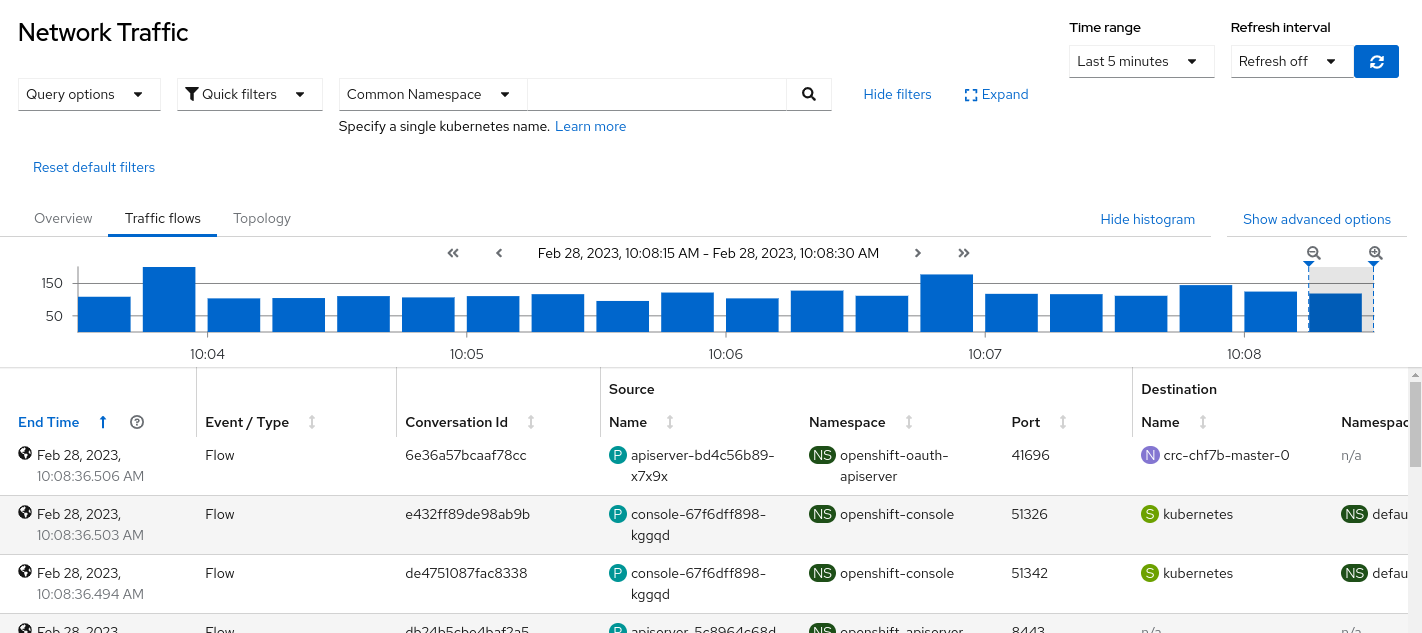
In Observe > Network Traffic, the flow table shows 100, 500 or 1000 flows that match your filter (if any), depending on the setting under Query Options. The minimal requirement is to be able to see the next page of data and to be able to see the previous page of data. The other request is to be able to jump to the first page, last page, or any page.
Some issues to consider:
- What happens when you get the next set of data and more data has arrived?
- Will it show how many pages of data there are (e.g. Page 2 of 10)?
---
Histogram enable a new toolbar view to visualize history of flows as a bar chart without hitting the Loki query limit.

This view is only available in table tab but could be also introduced in other tabs in the future.
The user is able to select a part of the histogram to filter the table below, preventing the loki limit to be hit when possible. To do so, you can long press on the histogram and move the mouse:
- if possible, it will automatically select a maximum of logs according to the limit in query options
- else the user will be free to select any timerange
To explain this feature, an integrated tour has been added into the console plugin
- is duplicated by
-
NETOBSERV-659 Duplicate - Pagination in NetFlow Table
-
- To Do
-
- links to
