-
Bug
-
Resolution: Done
-
Normal
-
None
-
openshift-4.11
-
Quality / Stability / Reliability
-
False
-
-
None
-
None
-
None
-
None
-
None
-
None
-
None
-
None
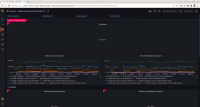
Using the Grafana JSON file at https://github.com/netobserv/network-observability-operator/blob/main/config/samples/dashboards/Network%20Observability.json, often times, it will fail to display one or more panels with the error message saying "too many outstanding requests". See attachment. This can happen immediately, but more likely after some time since it defaults to auto-refreshing every 30 seconds.
There are discussions about this problem at https://github.com/grafana/loki/issues/4613.
This was seen in Grafana 8.5.1 and 9.1.0 in a 3-worker node environment.
- relates to
-
NETOBSERV-547 (documentation effort) Tweak loki config
-
- Closed
-
