-
Story
-
Resolution: Won't Do
-
 Undefined
-
None
-
None
-
None
-
None
-
False
-
None
-
False
-
None
-
None
-
None
-
None
-
None
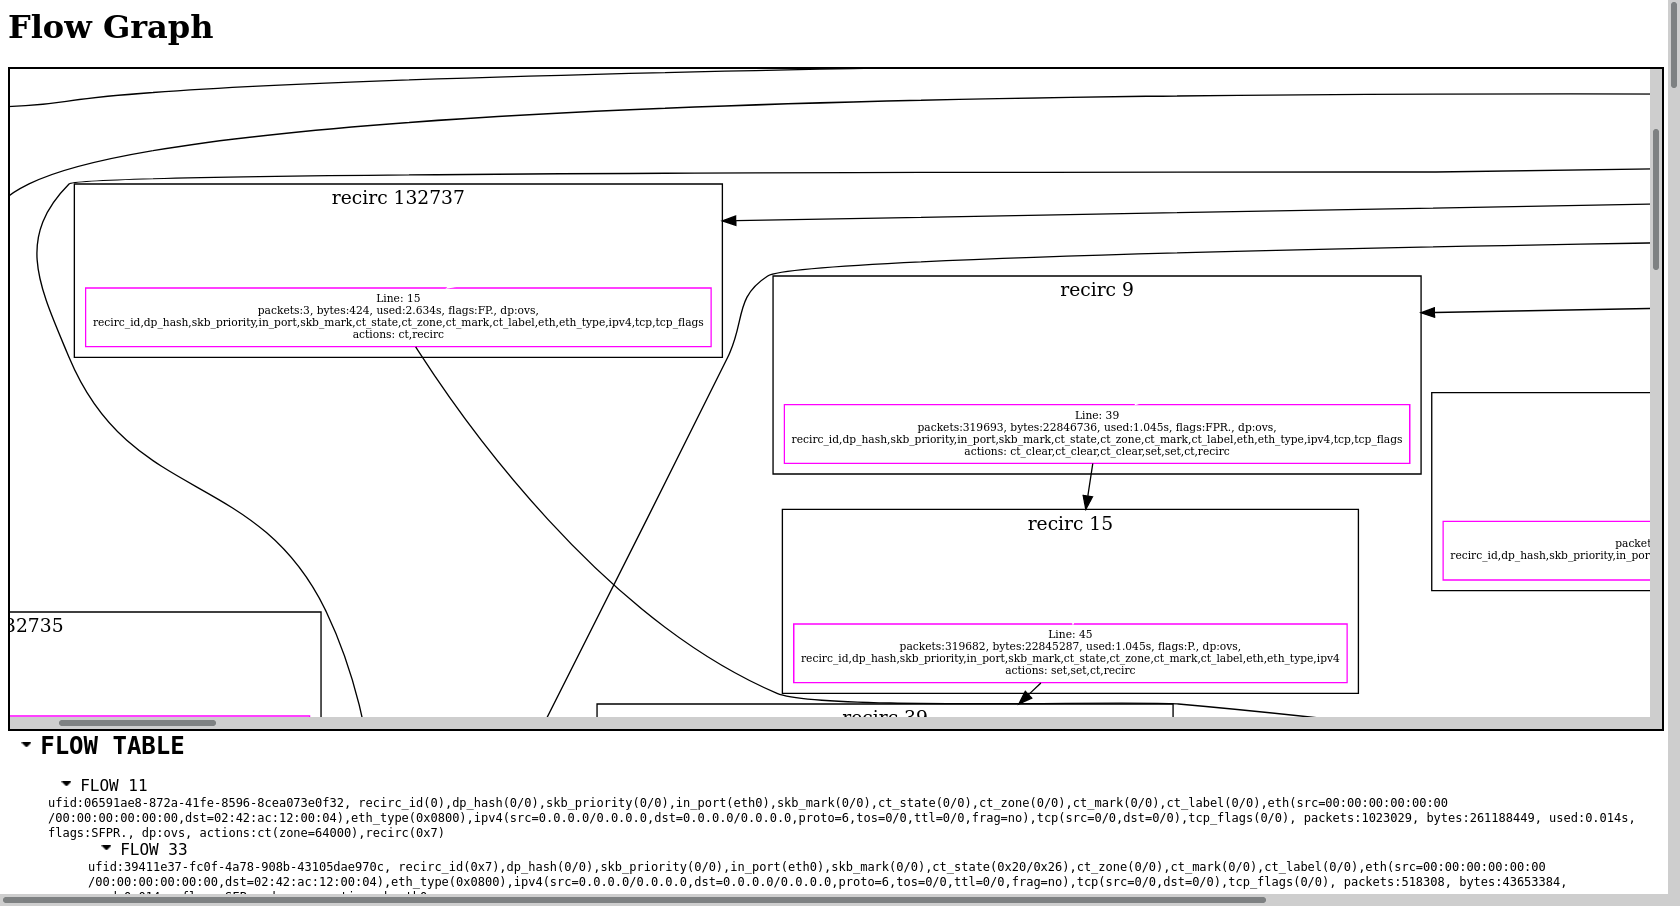
Important remark : "datapath flows" here is not the same as netflow / ipfix, it doesn't directly relate to our other work around netflows.
A datapath flows chart is per-ovs; unlike the netflow graph, it does not represent the whole traffic occurring inside the cluster, but the datapath inside an OVS node.
Showing a graph of datapath flows could be a great help for troubleshooting the network. We could start thinking about how it could be represented and integrated into the future netobserv dashboards.
There's an example of such a flow chart (cropped) in attachments.