Uploaded image for project: 'Network Observability'
  1. Network Observability
  2. NETOBSERV-297

(v0.1.1) Some Grafana dashboards are not showing up

    • Icon: Bug Bug
    • Resolution: Done
    • Icon: Normal Normal
    • None
    • None
    • Grafana, Operator
    • None
    • False
    • None
    • False

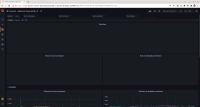
      In v0.1.1, three Grafana dashboards are not showing up when importing the file from:

      https://raw.githubusercontent.com/netobserv/network-observability-operator/release-4.10/config/samples/dashboards/Network%20Observability.json

      1. Total flows
      2. Flows by source namespace
      3. Flows by destination namespace

      The volumetry graphs and Logs (NetFlows) are okay.

      Workaround: Edit the graph and make any change (e.g. add a space and remove a space).  Then the graph comes up.

              stlee@redhat.com Steven Lee
              stlee@redhat.com Steven Lee
              Votes:
              0 Vote for this issue
              Watchers:
              4 Start watching this issue

                Created:
                Updated:
                Resolved: