-
Bug
-
Resolution: Unresolved
-
 Normal
-
None
-
netobserv-1.9, netobserv-1.10
-
None
-
Quality / Stability / Reliability
-
False
-
-
None
-
Moderate
-
None
-
None
-
None
-
None
-
None
-
None
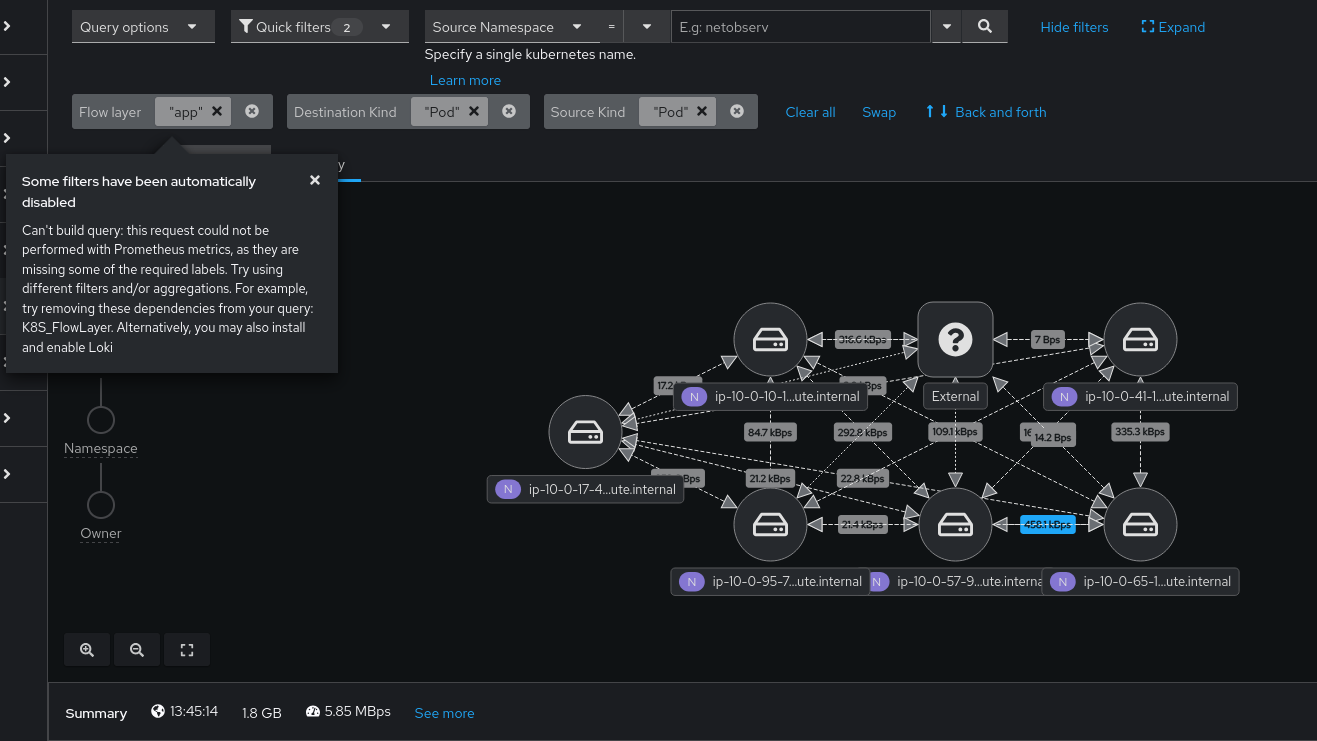
Description of problem:
Running in Loki-less mode, clicking Node or Network (UDN enabled) results in an error message that is impossible to clear.   Things attempted:

- Go back to network summary view
- Reload browser page
- log out/in to console

Only a cache clear helps.  I would expect to be able to recover a usable network observability view without the cache clear.  This happens on Chrome and FF

Can't build query: this request could not be performed with Prometheus
metrics, as they are missing some of the required labels. Try using
different filters and/or aggregations. For example, try removing these
dependencies from your query: SrcK8S_HostName, DstK8S_HostName.
Alternatively, you may also install and enable Loki

Dev tools doesn't show much.   Before the bad click there are repeated periodic messages with:

"netflow-traffic.ts:100 ProgressStep: The titleId and id properties are required to make this component accessible, and one or both of these properties are missing."

After the bad click, there is:
"co-fetch.ts:124 GET https://console-openshift-console.apps.mffiedler1105c.qe.devcluster.openshift.com/api/check-package-manifest/?name=lightspeed-operator&namespace=openshift-marketplace 500 (Internal Server Error)"
Steps to Reproduce:
1. Install NetObserv Loki-less (I used 1.10 on OCP 4.20 but I have seen this with 1.9.3 on 4.19)
2. Go to the Network Observability Topo view
3. Click Node in the hierarchy
Actual results:
Error message with no way to get free of it without cache clear.