-
Story
-
Resolution: Done
-
 Undefined
-
None
-
None
-
None
-
None
-
False
-
-
False
-
5
-
None
-
None
-
NetObserv - Sprint 274, NetObserv - Sprint 275, NetObserv - Sprint 276, NetObserv - Sprint 277
Console plugin should read the alerts definitions and firing status (or execute related promql) to display:
- a global network health indicator, that is an aggregation of all alert statuses
- per-alert status
It fetches all alerts having the annotation "netobserv.io/health".
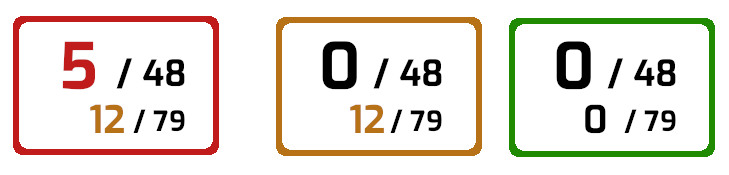
The global indicator should work as follow:
- it takes the highest severity of all firing alerts, with color codes (red=critical, yellow=warning etc.)
- it shows a score of number of firing alerts / number of total alerts for each severity
Here's an example showing 3 different states (not final design - must be patternflied) : 
Below that, for each firing alert, the list of targets (labels) for which it is firing, and the metric value compared to threshold, in a table.
Table headers are:
- alert name
- source (source-prefixed labels set)
- destination (destination-prefixed labels set)
- labels (other labels set)
- severity
- metric value
- threshold
- trend
The trend indicates the evolution over time.
For instance, this promql:
100 * sum (rate(netobserv_namespace_drop_packets_total[1h])) / sum (rate(netobserv_namespace_ingress_packets_total[1h])) - 100 * sum(rate (netobserv_namespace_drop_packets_total[1h] offset 2h)) / sum(rate(netobserv_namespace_ingress_packets_total[1h] offset 2h))

=> value: 1.48
shows %drops now compared to 2h ago (+1.48%)