-
Bug
-
Resolution: Done
-
 Major
Major
-
netobserv-1.7, netobserv-1.8-candidate
-
Quality / Stability / Reliability
-
False
-
-
None
-
None
-
None
-
None
-
NetObserv - Sprint 265, NetObserv - Sprint 266
-
None
-
None
-
None
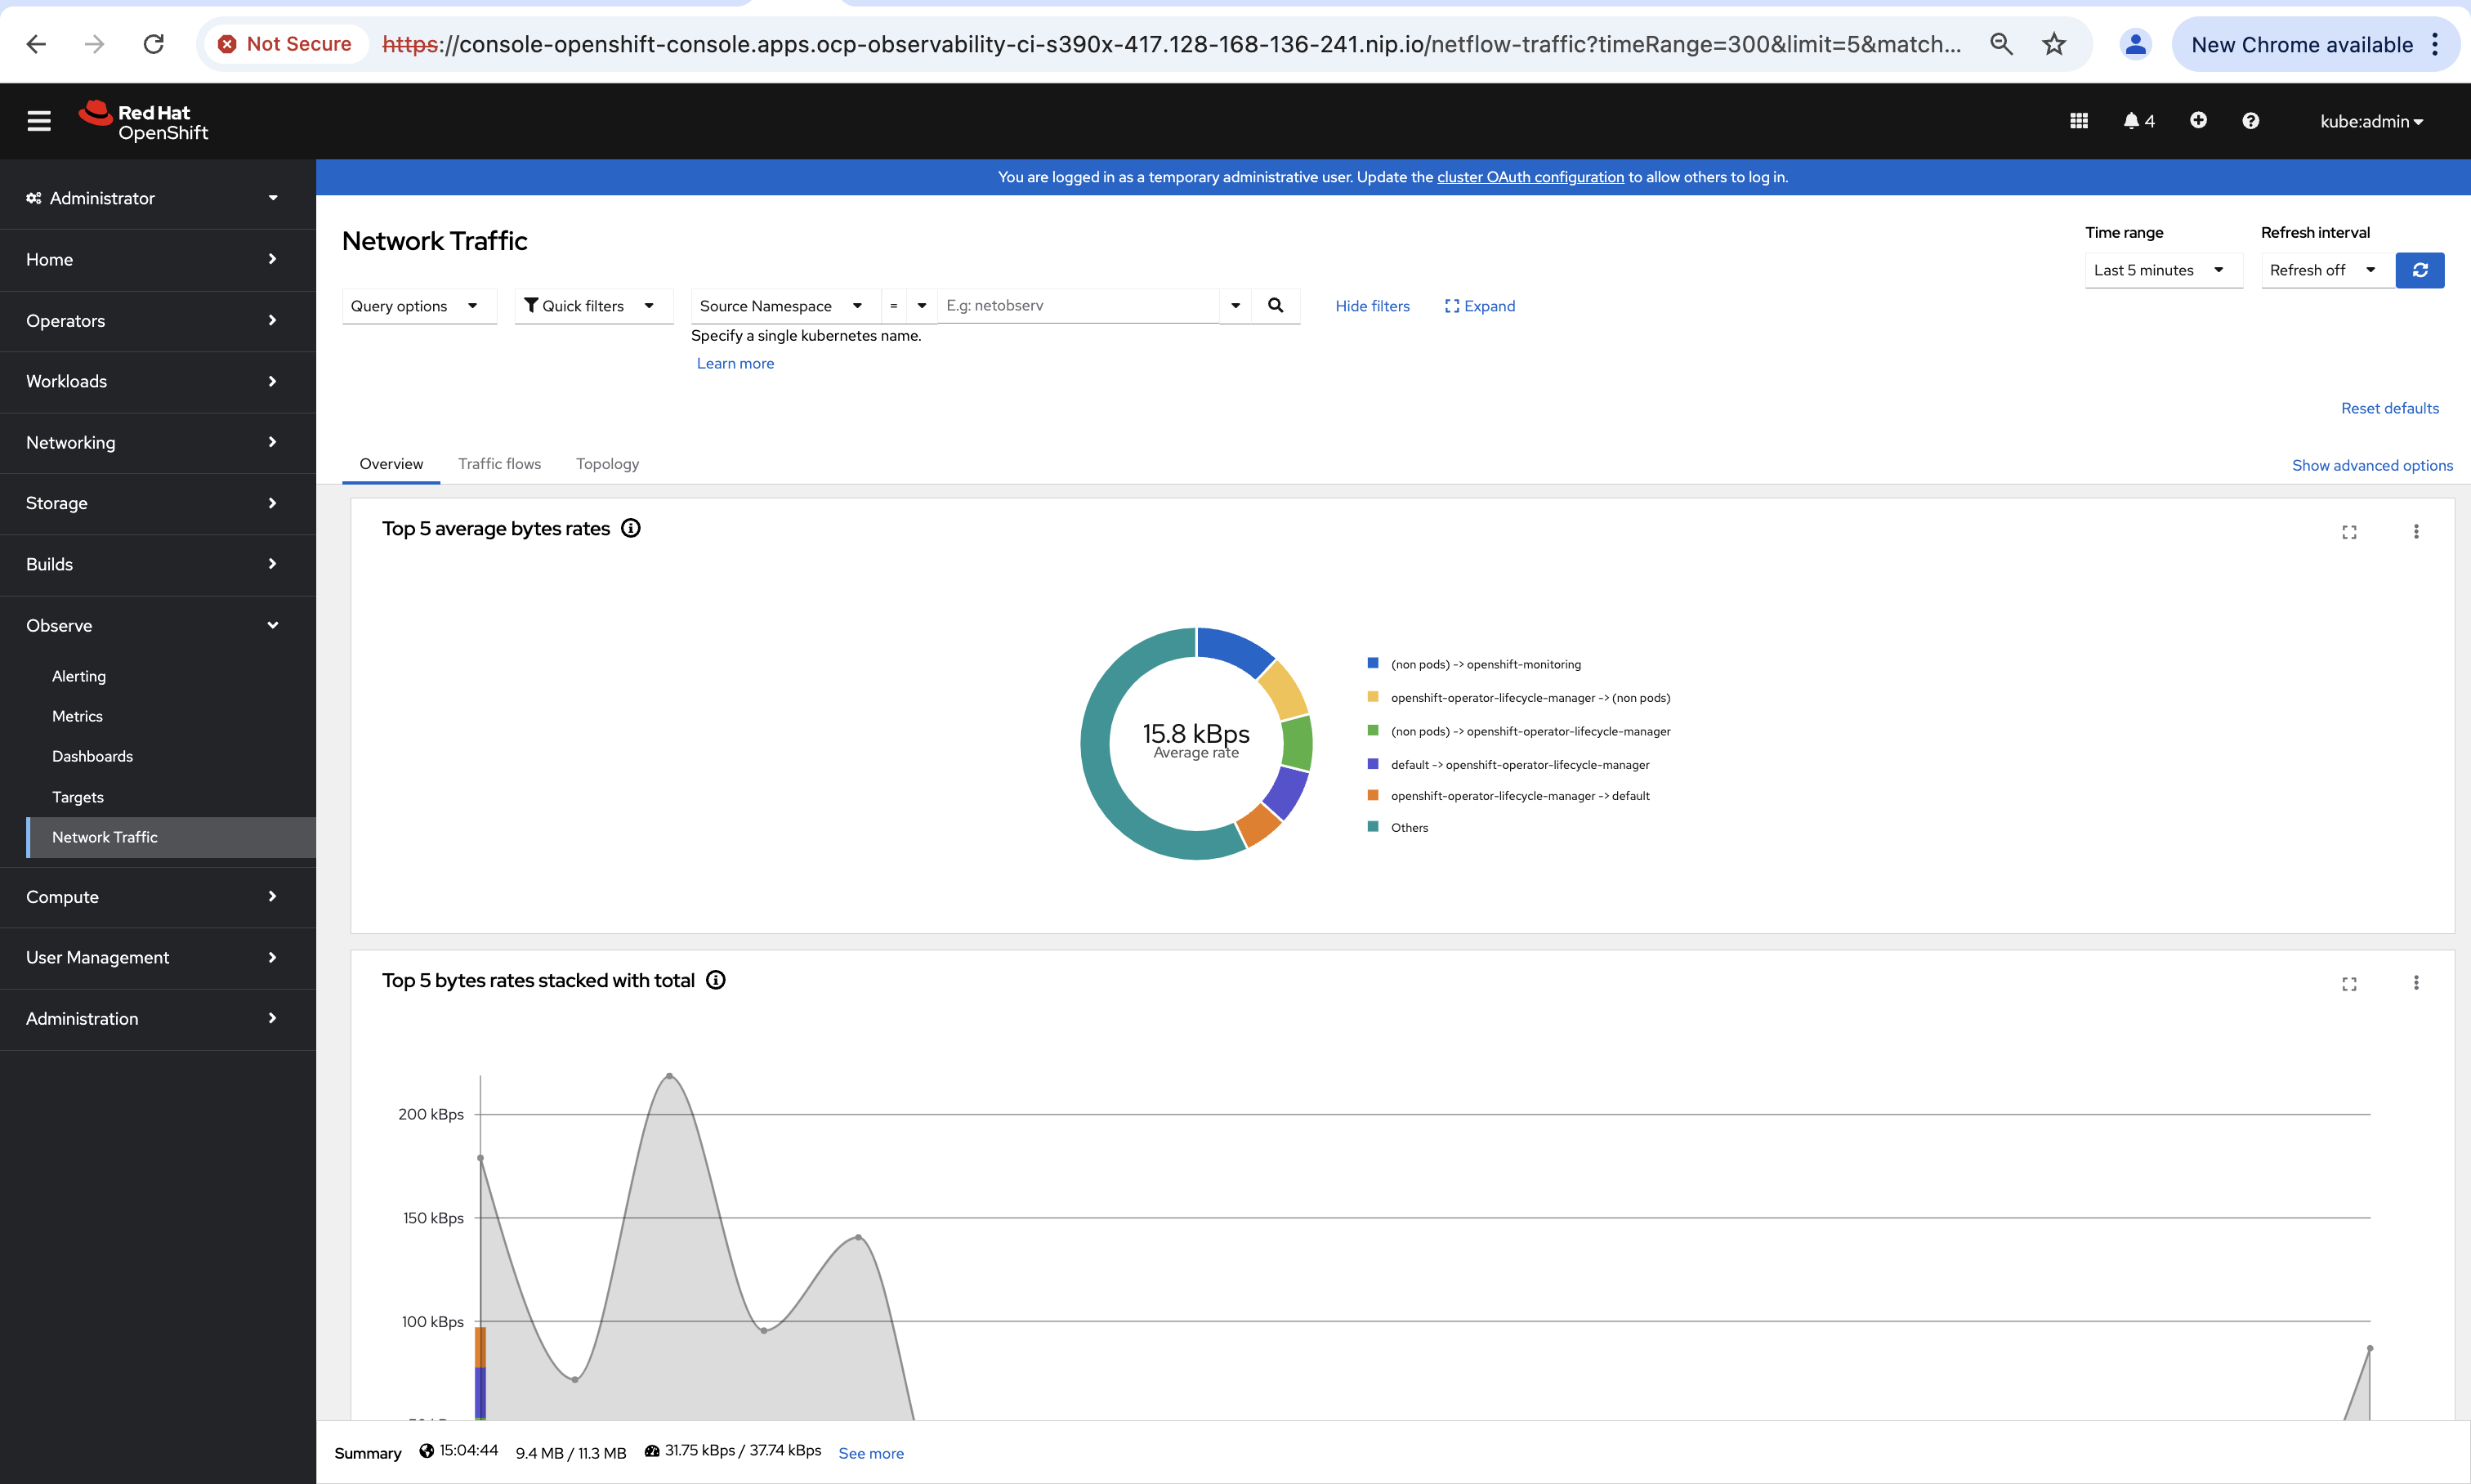
Description of problem:
I was trying to setup NetObserv v1.7, but getting error on console but pods and lokistack looks good:
    [root@ocpz-m42lp36-bastion jitendra]# oc get co
NAME                    VERSION  AVAILABLE  PROGRESSING  DEGRADED  SINCE  MESSAGE
authentication               4.16.2  True    False     False   7h55m
baremetal                 4.16.2  True    False     False   31d
cloud-controller-manager          4.16.2  True    False     False   31d
cloud-credential              4.16.2  True    False     False   31d
cluster-autoscaler             4.16.2  True    False     False   31d
config-operator              4.16.2  True    False     False   31d
console                  4.16.2  True    False     False   9d
control-plane-machine-set         4.16.2  True    False     False   31d
csi-snapshot-controller          4.16.2  True    False     False   11d
dns                    4.16.2  True    False     False   7d14h
etcd                    4.16.2  True    False     False   23d
image-registry               4.16.2  True    False     False   31d
ingress                  4.16.2  True    False     False   31d
insights                  4.16.2  True    False     False   31d
kube-apiserver               4.16.2  True    False     False   31d
kube-controller-manager          4.16.2  True    False     False   31d
kube-scheduler               4.16.2  True    False     False   31d
kube-storage-version-migrator       4.16.2  True    False     False   2d18h
machine-api                4.16.2  True    False     False   31d
machine-approver              4.16.2  True    False     False   31d
machine-config               4.16.2  True    False     False   31d
marketplace                4.16.2  True    False     False   31d
monitoring                 4.16.2  True    False     False   15h
network                  4.16.2  True    False     False   31d
node-tuning                4.16.2  True    False     False   31d
openshift-apiserver            4.16.2  True    False     False   12h
openshift-controller-manager        4.16.2  True    False     False   9d
openshift-samples             4.16.2  True    False     False   31d
operator-lifecycle-manager         4.16.2  True    False     False   31d
operator-lifecycle-manager-catalog     4.16.2  True    False     False   31d
operator-lifecycle-manager-packageserver  4.16.2  True    False     False   27h
service-ca                 4.16.2  True    False     False   31d
storage                  4.16.2  True    False     False   31d
[root@ocpz-m42lp36-bastion jitendra]# oc get csv
ocNAME                        DISPLAY             VERSION          REPLACES                PHASE
cluster-logging.v5.9.10              Red Hat OpenShift Logging    5.9.10           cluster-logging.v5.9.9         Succeeded
cluster-observability-operator.v1.0.0       Cluster Observability Operator  1.0.0                               Succeeded
loki-operator.v5.9.10               Loki Operator          5.9.10           loki-operator.v5.9.9          Succeeded
network-observability-operator.v1.7.0       Network Observability      1.7.0           network-observability-operator.v1.6.2  Succeeded
opentelemetry-operator.v0.107.0-4-0.1727168137.p  Red Hat build of OpenTelemetry  0.107.0-4+0.1727168137.p  opentelemetry-operator.v0.102.0-3    Succeeded
[root@ocpz-m42lp36-bastion jitendra]# oc get pods -n netobserv
NAME                 READY  STATUS  RESTARTS  AGE
flowlogs-pipeline-989n4        1/1   Running  0     3h8m
flowlogs-pipeline-9c46t        1/1   Running  0     3h8m
flowlogs-pipeline-9tln2        1/1   Running  0     3h8m
flowlogs-pipeline-bfqh6        1/1   Running  0     3h8m
flowlogs-pipeline-k5jzm        1/1   Running  0     3h8m
flowlogs-pipeline-knwrr        1/1   Running  0     3h8m
loki-compactor-0           1/1   Running  0     43m
loki-distributor-5b9cc4998f-v9b7z   1/1   Running  0     43m
loki-gateway-6f9468b96-spz6w     2/2   Running  0     42m
loki-gateway-6f9468b96-xg2t5     2/2   Running  0     42m
loki-index-gateway-0         1/1   Running  0     42m
loki-ingester-0            1/1   Running  0     43m
loki-querier-5c9848f6c-jwxsl     1/1   Running  0     43m
loki-query-frontend-b9c5ccf5d-rkrrm  1/1   Running  0     43m
netobserv-plugin-66779c9486-jdhb8   1/1   Running  0     3h8m
[root@ocpz-m42lp36-bastion jitendra]# oc logs flowlogs-pipeline-989n4 -n netobserv
Starting flowlogs-pipeline:
=====
Build Version: v1.7.0
Build Date: 2024-10-14 16:14
Using configuration:
{
  "PipeLine": "[{\"name\":\"grpc\"},{\"follows\":\"grpc\",\"name\":\"enrich\"},{\"follows\":\"enrich\",\"name\":\"loki\"},{\"follows\":\"enrich\",\"name\":\"prometheus\"}]",
  "Parameters": "[{\"ingest\":{\"grpc\":{\"port\":2055},\"type\":\"grpc\"},\"name\":\"grpc\"},{\"name\":\"enrich\",\"transform\":{\"network\":{\"directioninfo\":{\"dsthostfield\":\"DstK8S_HostIP\",\"flowdirectionfield\":\"FlowDirection\",\"reporteripfield\":\"AgentIP\",\"srchostfield\":\"SrcK8S_HostIP\"},\"kubeconfig\":{},\"rules\":[{\"kubernetes\":{\"interfacesfield\":\"Interfaces\",\"ipfield\":\"SrcAddr\",\"macfield\":\"SrcMac\",\"output\":\"SrcK8S\"},\"type\":\"add_kubernetes\"},{\"kubernetes\":{\"interfacesfield\":\"Interfaces\",\"ipfield\":\"DstAddr\",\"macfield\":\"DstMac\",\"output\":\"DstK8S\"},\"type\":\"add_kubernetes\"},{\"type\":\"reinterpret_direction\"},{\"kubernetes_infra\":{\"infra_prefixes\":[\"netobserv\",\"openshift\"],\"infra_refs\":[{\"name\":\"kubernetes\",\"namespace\":\"default\"},{\"name\":\"openshift\",\"namespace\":\"default\"}],\"namespacenamefields\":[{\"name\":\"SrcK8S_Name\",\"namespace\":\"SrcK8S_Namespace\"},{\"name\":\"DstK8S_Name\",\"namespace\":\"DstK8S_Namespace\"}],\"output\":\"K8S_FlowLayer\"},\"type\":\"add_kubernetes_infra\"},{\"add_subnet_label\":{\"input\":\"SrcAddr\",\"output\":\"SrcSubnetLabel\"},\"type\":\"add_subnet_label\"},{\"add_subnet_label\":{\"input\":\"DstAddr\",\"output\":\"DstSubnetLabel\"},\"type\":\"add_subnet_label\"}],\"subnetlabels\":[{\"cidrs\":[\"10.128.0.0/14\"],\"name\":\"Pods\"},{\"cidrs\":[\"172.30.0.0/16\"],\"name\":\"Services\"},{\"cidrs\":[\"10.0.0.0/16\"],\"name\":\"Machines\"}]},\"type\":\"network\"}},{\"name\":\"loki\",\"write\":{\"loki\":{\"batchsize\":102400,\"batchwait\":\"1s\",\"clientconfig\":{\"authorization\":{\"credentials_file\":\"/var/run/secrets/tokens/flowlogs-pipeline\",\"type\":\"Bearer\"},\"enable_http2\":false,\"follow_redirects\":false,\"proxy_url\":null,\"tls_config\":{\"ca_file\":\"/var/loki-certs-ca/service-ca.crt\",\"insecure_skip_verify\":false}},\"labels\":[\"SrcK8S_Namespace\",\"SrcK8S_OwnerName\",\"SrcK8S_Type\",\"DstK8S_Namespace\",\"DstK8S_OwnerName\",\"DstK8S_Type\",\"K8S_FlowLayer\",\"FlowDirection\"],\"maxbackoff\":\"5s\",\"maxretries\":2,\"minbackoff\":\"1s\",\"staticlabels\":{\"app\":\"netobserv-flowcollector\"},\"tenantid\":\"network\",\"timeout\":\"10s\",\"timestamplabel\":\"TimeFlowEndMs\",\"timestampscale\":\"1ms\",\"url\":\"https://loki-gateway-http.netobserv.svc:8080/api/logs/v1/network/\"},\"type\":\"loki\"}}]",
  "DynamicParameters": "{\"filename\":\"config.json\",\"name\":\"flowlogs-pipeline-config-dynamic\",\"namespace\":\"netobserv\"}",
  "MetricsSettings": "{\"nopanic\":true,\"port\":9401,\"prefix\":\"netobserv_\"}",
  "Health": {
    "Address": "0.0.0.0",
    "Port": "8080"
  },
  "Profile": {
    "Port": 6060
  }
}
time=2024-12-11T09:56:39Z level=info msg=StartServerAsync: addr = :9401 component=prometheus
time=2024-12-11T09:56:40Z level=info msg=connecting stages: grpc --> enrich
time=2024-12-11T09:56:40Z level=info msg=connecting stages: enrich --> loki
time=2024-12-11T09:56:40Z level=info msg=connecting stages: enrich --> prometheus
time=2024-12-11T09:56:40Z level=info msg=starting PProf HTTP listener port=6060
[root@ocpz-m42lp36-bastion jitendra]#
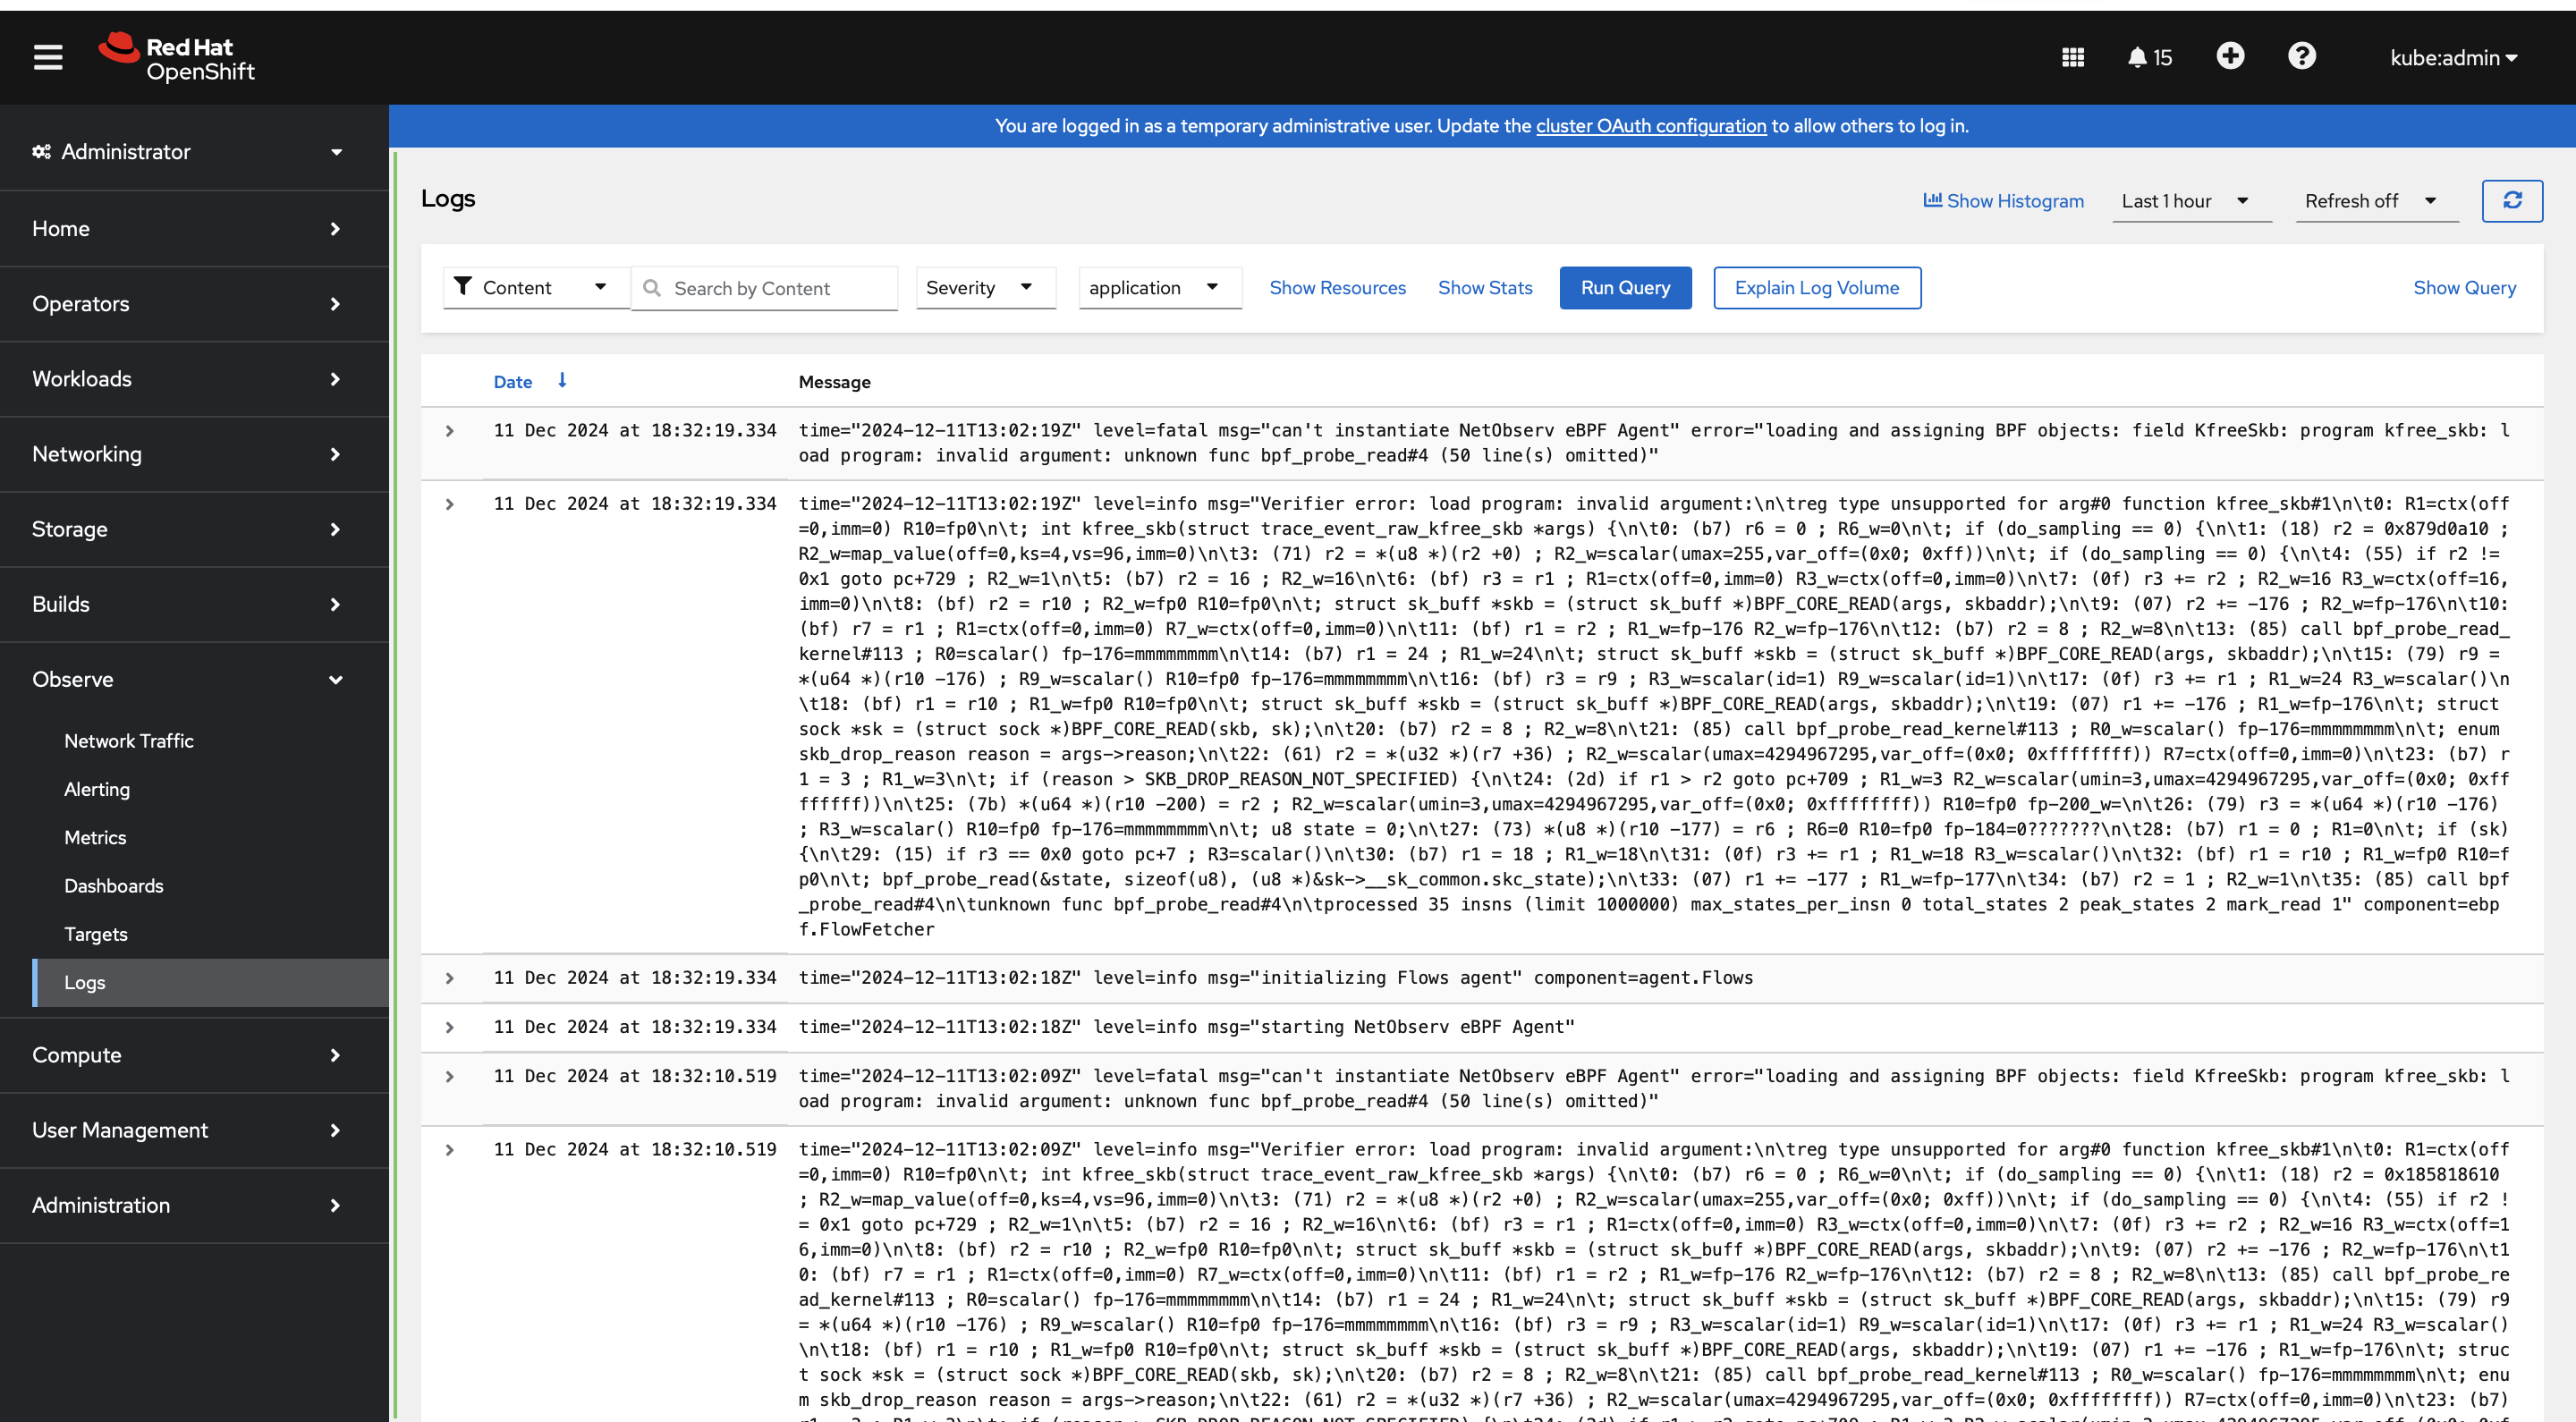
It seems like bpf_probe_read function is not available in the kernel !
Version-Release number of selected component (if applicable):
OpenShift version : 4.16
It's RHEL 9 only this is right kernel version :[core@ocpz-m42lp36-compute-0 ~]$ uname -a
Linux ocpz-m42lp36-compute-0 5.14.0-427.24.1.el9_4.s390x #1 SMP Sun Jun 23 11:54:29 EDT 2024 s390x s390x s390x GNU/Linux
[core@ocpz-m42lp36-compute-0 ~]${code}
How reproducible:
{code:none}
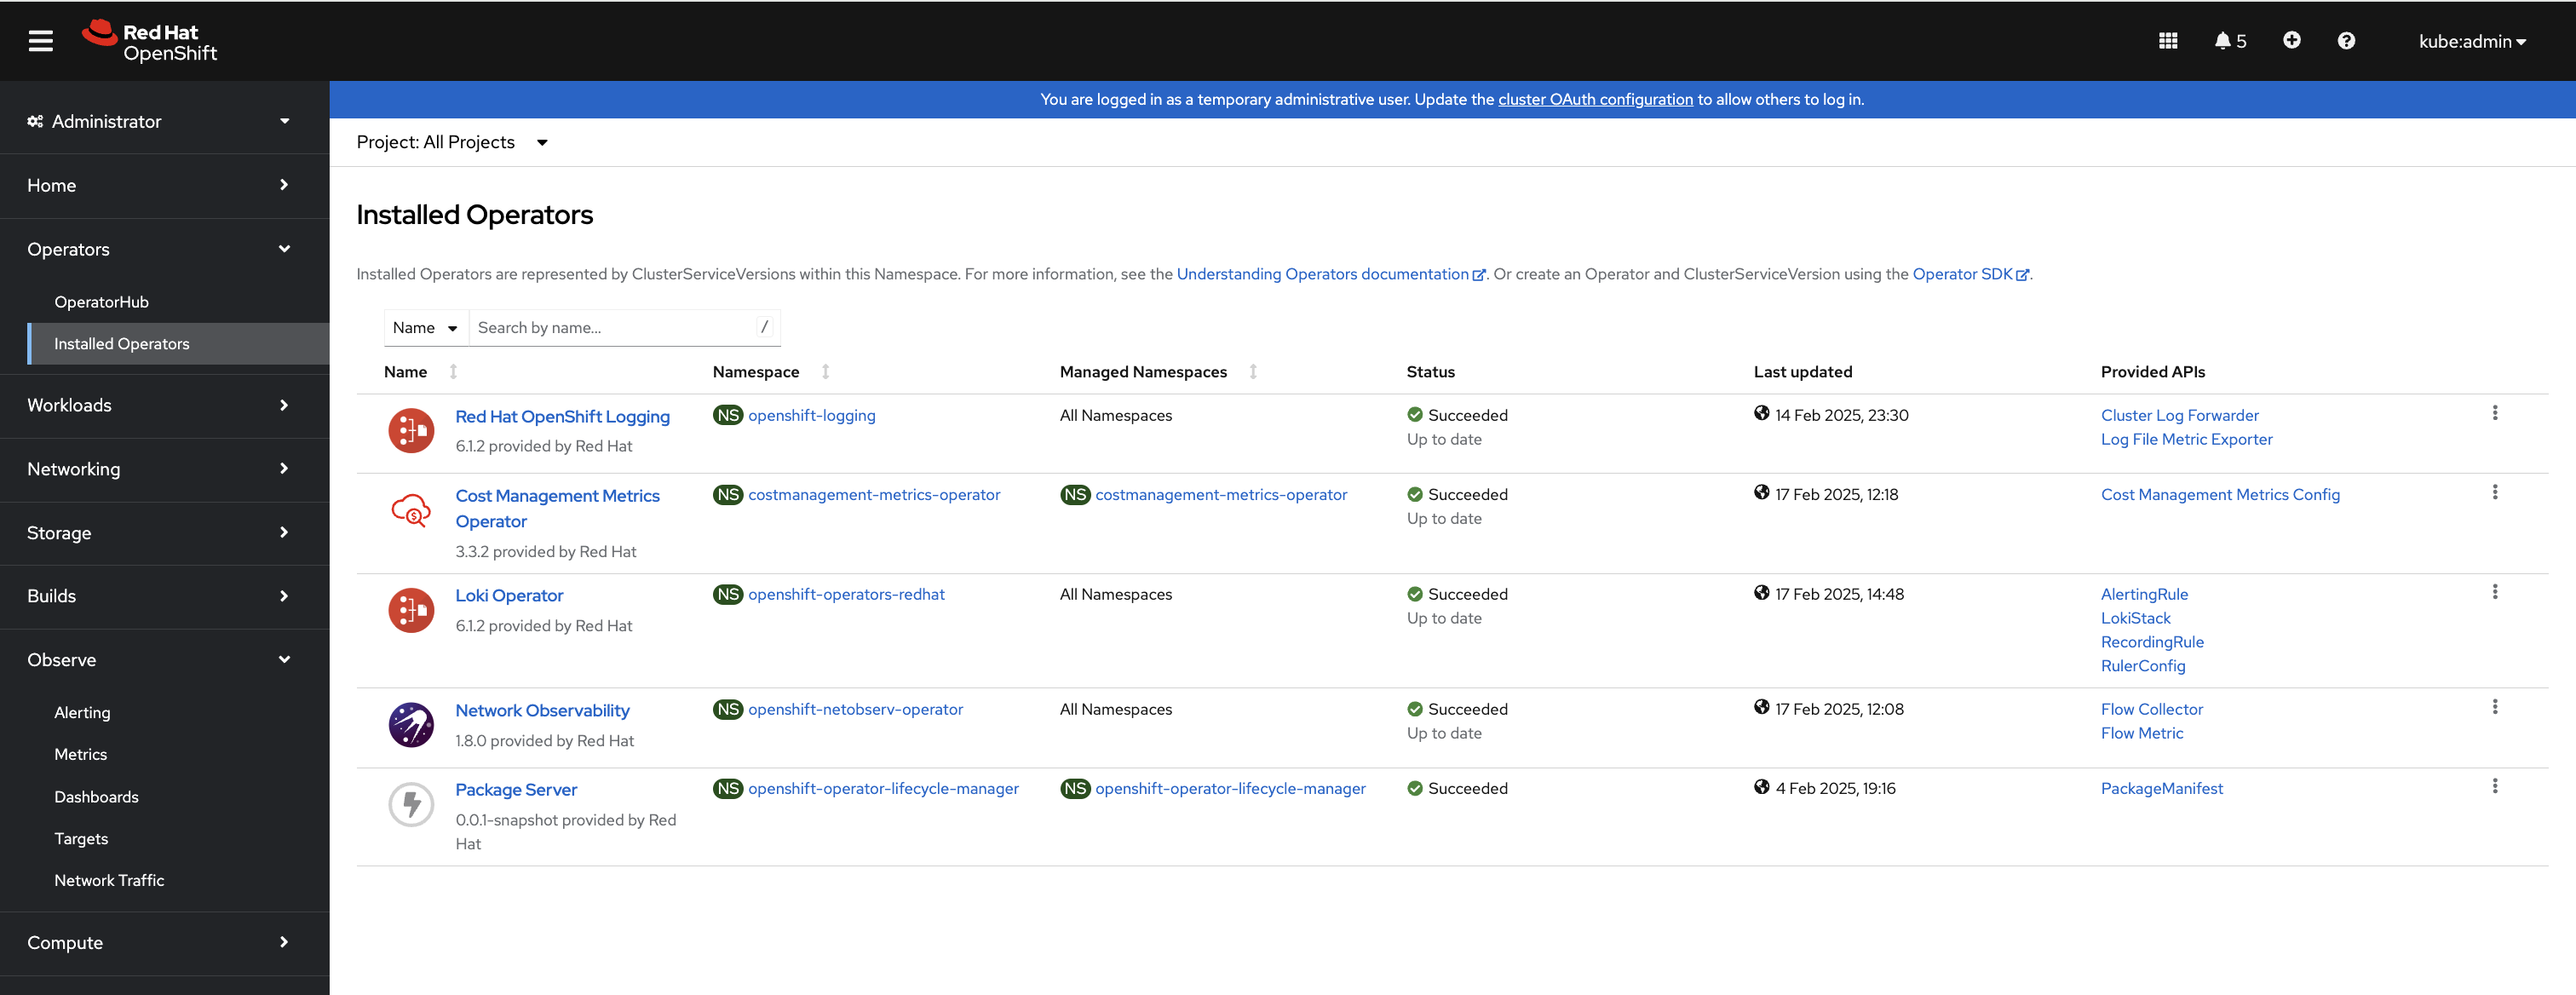
Just try to install Network Observability Operator from Operatorhub
Steps to Reproduce:
    1. Just try to install Network Observability Operator from Operatorhub.       2. Now, Go to Observe tab to check the status of Network traffic.
    3.
Actual results:
Netobserv flowlogs-pipeline is not receving an y flow, this is either a connection issue with agent.
Expected results:
We must be able to the data in dashboard
Additional info: