-
Bug
-
Resolution: Done
-
 Major
Major
-
None
-
None
-
None
-
Quality / Stability / Reliability
-
False
-
None
-
None
-
None
-
None
-
None
-
NetObserv - Sprint 213
-
None
-
None
-
None
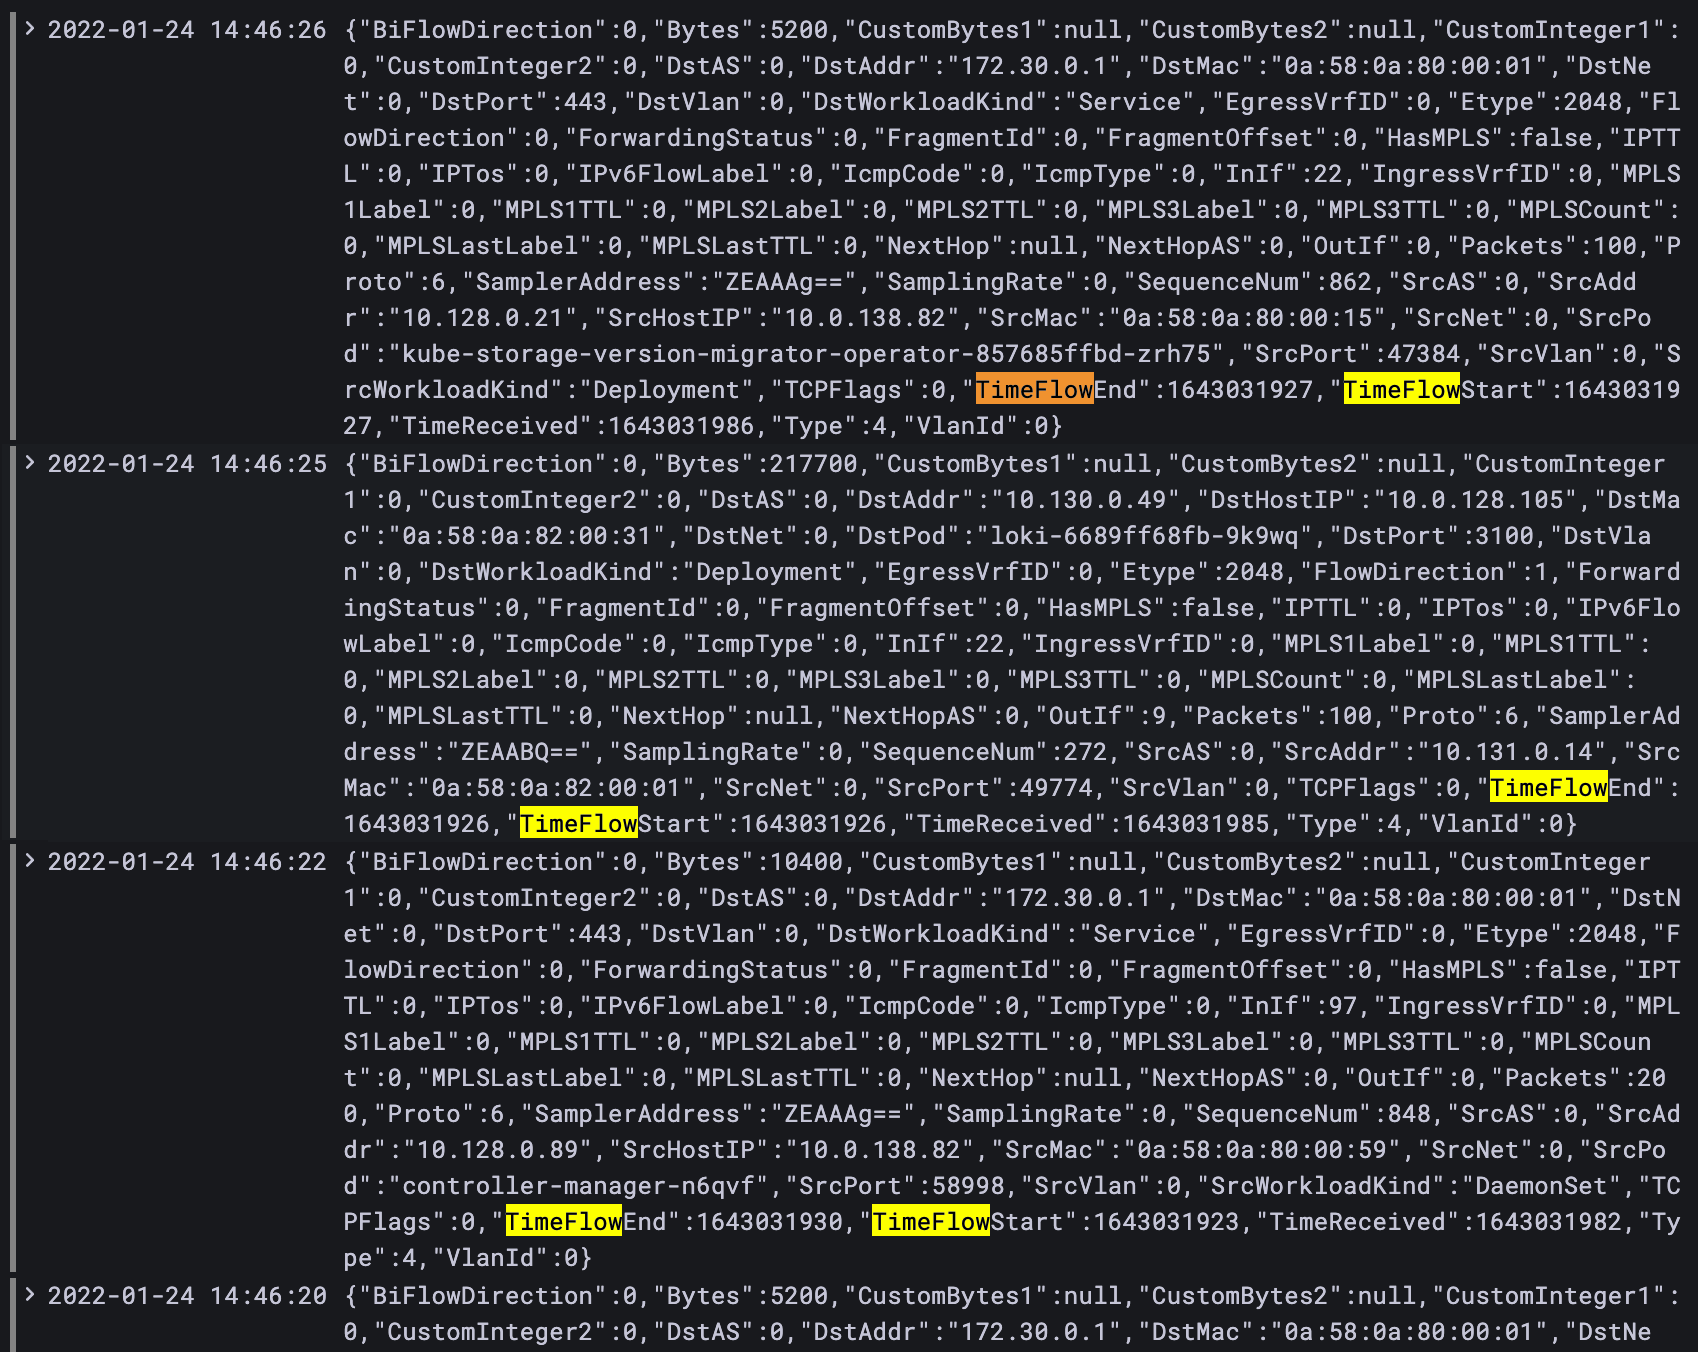
Looks like there was a regression at some point, in the json pulled from the console plugin, TimeFlowStart and TimeFlowEnd are always 0, hence I guess the timestamp used is taken from TimeReceived.
JSON Example:
{
	"0": [
		"1642070366000000000",
		"{\"BiFlowDirection\":0,\"Bytes\":5200,\"DstAS\":0,\"DstAddr\":\"172.30.0.1\",\"DstMac\":\"0a:58:0a:81:00:01\",\"DstNet\":0,\"DstPort\":443,\"DstVlan\":0,\"DstWorkloadKind\":\"Service\",\"EgressVrfID\":0,\"Etype\":2048,\"FlowDirection\":0,\"ForwardingStatus\":0,\"FragmentId\":0,\"FragmentOffset\":0,\"HasMPLS\":false,\"IPTTL\":0,\"IPTos\":0,\"IPv6FlowLabel\":0,\"IcmpCode\":0,\"IcmpType\":0,\"InIf\":28,\"IngressVrfID\":0,\"MPLS1Label\":0,\"MPLS1TTL\":0,\"MPLS2Label\":0,\"MPLS2TTL\":0,\"MPLS3Label\":0,\"MPLS3TTL\":0,\"MPLSCount\":0,\"MPLSLastLabel\":0,\"MPLSLastTTL\":0,\"NextHop\":null,\"NextHopAS\":0,\"OutIf\":0,\"Packets\":100,\"Proto\":6,\"SamplerAddress\":\"ZEAAAw==\",\"SamplingRate\":0,\"SequenceNum\":5885,\"SrcAS\":0,\"SrcAddr\":\"10.129.0.19\",\"SrcHostIP\":\"10.0.158.254\",\"SrcMac\":\"0a:58:0a:81:00:13\",\"SrcNet\":0,\"SrcPod\":\"prometheus-k8s-1\",\"SrcPort\":41916,\"SrcVlan\":0,\"SrcWorkloadKind\":\"StatefulSet\",\"TCPFlags\":0,\"TimeFlowEnd\":0,\"TimeFlowStart\":0,\"TimeReceived\":1642070366,\"Type\":4,\"VlanId\":0}"
	]
}
- is cloned by
-
-

- Closed
-