-
Bug
-
Resolution: Done
-
 Major
Major
-
netobserv-1.4
-
None
-
Quality / Stability / Reliability
-
False
-
-
None
-
None
-
None
-
None
-
NetObserv - Sprint 246, NetObserv - Sprint 247
-
None
-
None
-
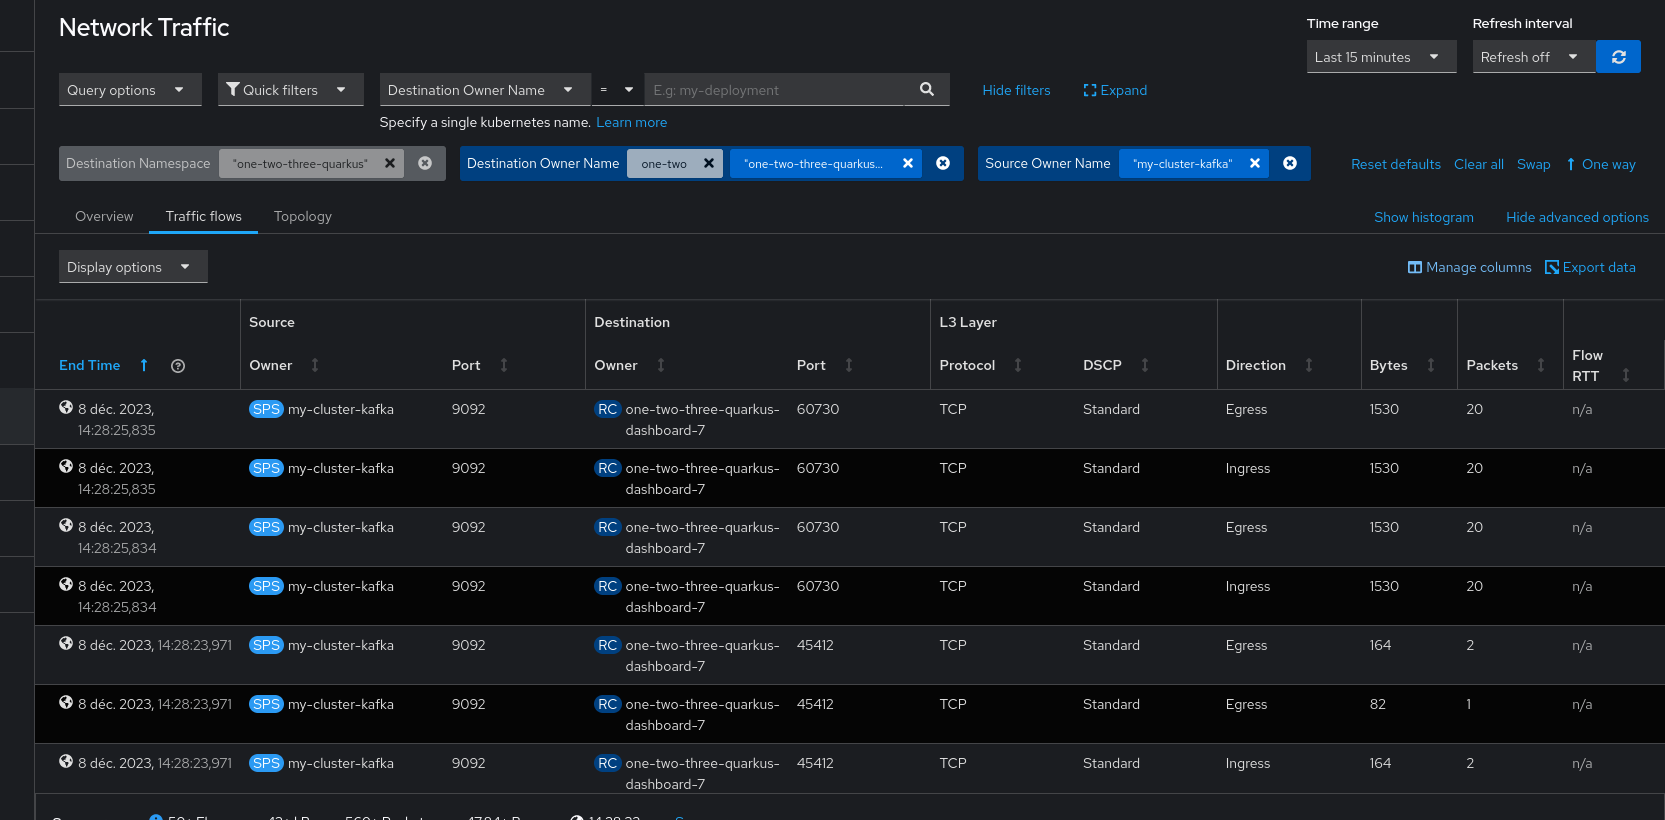
Description of problem:
I have setup a sample app [1] that involves microservices communicating via Kafka. One of the service receives events from Kafka. In netobserv, in the flow logs table I'm seeing this in and out traffic. But in the topology, overview and even in the prometheus metrics, I'm only seeing traffic from the service to kafka and not the other way around.
Steps to Reproduce:
Not sure yet how reproducible this is, however this was seen using this sample app: https://github.com/ia3andy/one-two-three-quarkus/
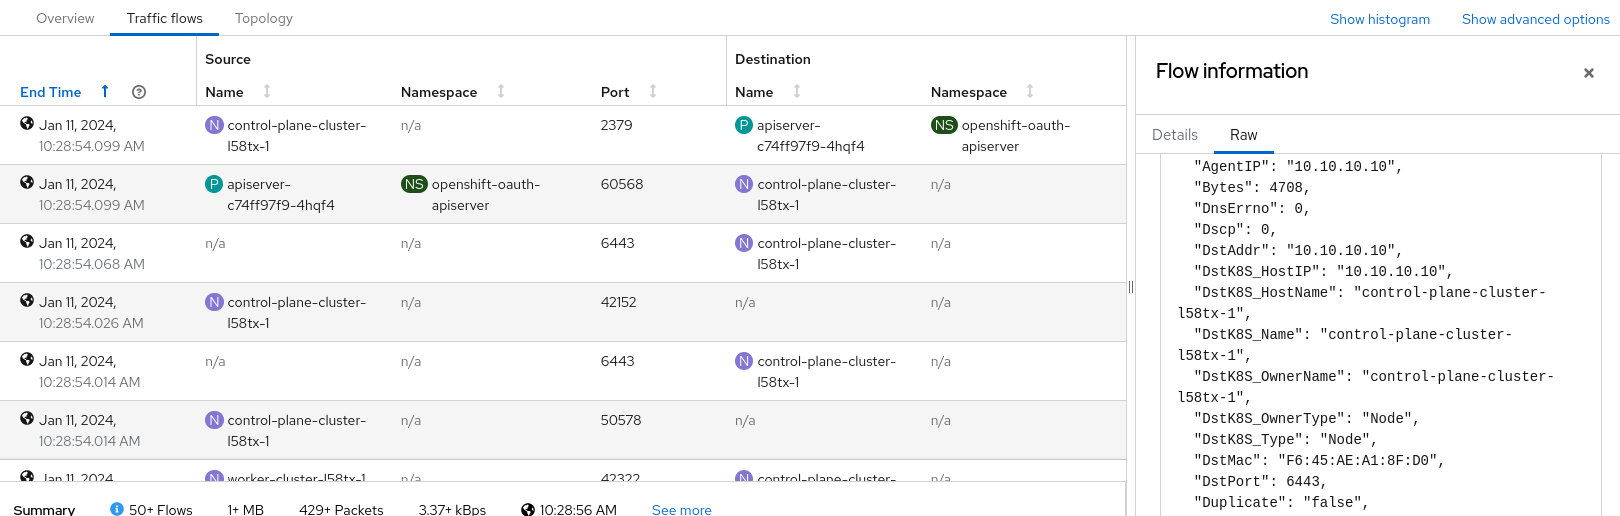
[EDIT after more investigation]
The bug is actually tied to a specific cluster configuration which I got by using a demo cluster on http://demo.redhat.com
I don't know how to reproduce a similar configuration on a more typical cluster (cluster-bot etc.). But I noticed a bunch of differences in netboserv when using that cluster compared to a standard one - for instance, traffic from routes where being seen as coming from nodes, without involving ingress router.
Note that the CNI was still OVN.
Anyway: with that config, the "AgentIP" in our flows is like "192.168.12.2" instead of using the machine network 10.10.10.0/24, which is the root cause of the bug seen.
Actual results:
cf screen captures
Expected results:
in/out Traffic seen in topology & overview & dashboards
PS : I haven't checked if it also affects 1.4
See also: two samples of flow json that are visible in flow table but not as metrics: sample.txt![]()