-
Epic
-
Resolution: Done-Errata
-
 Major
Major
-
None
-
networking-state-dashboards-1.4
-
To Do
-
None
-
0% To Do, 0% In Progress, 100% Done
-
False
-
None
-
False
-
L
-
None
This provides an at-a-glance overview of your network. There are already dashboards integrated in Observe -> dashboard -> NetObserv & NetObserv / Health on items related to networking (using flow-based metrics). This epic brings several enhancements to the initial work.
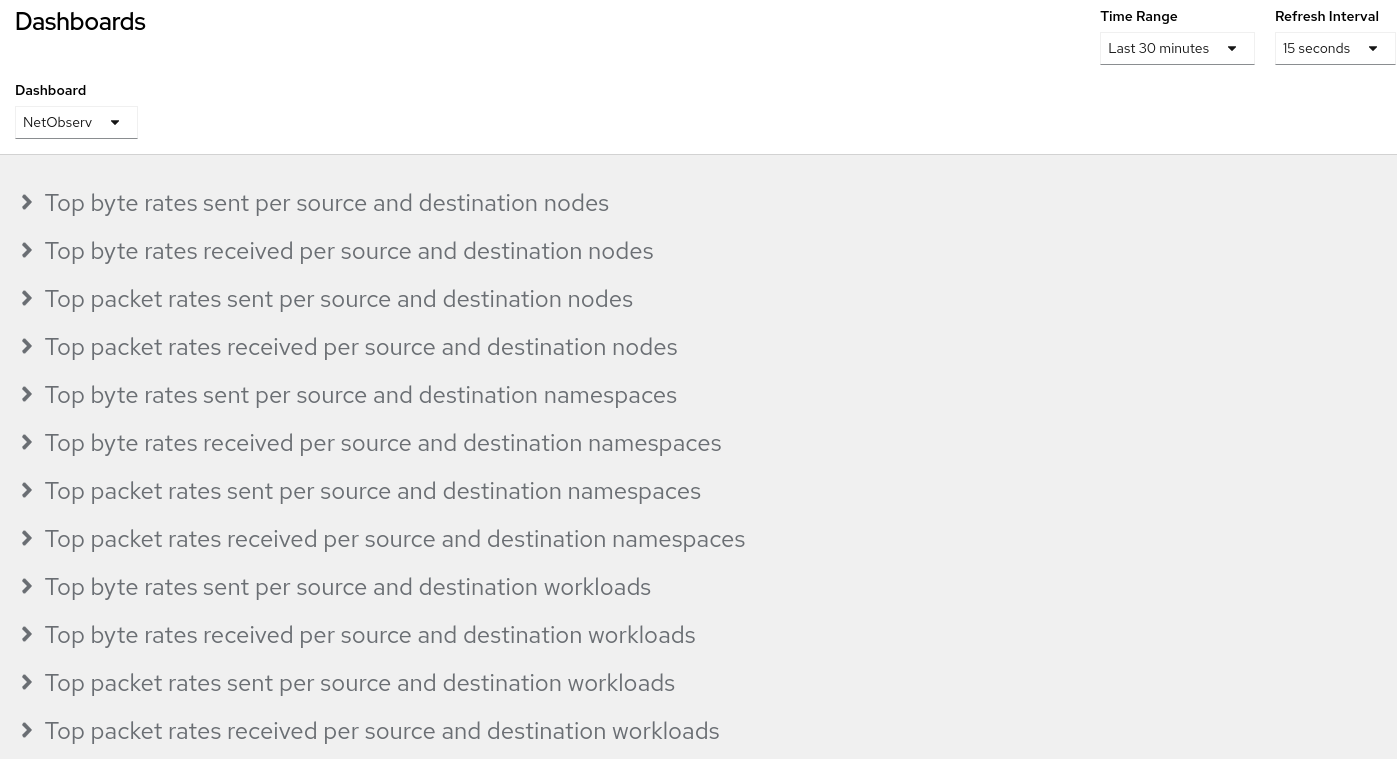
NetObserv dashboard now list the following sections:

Top bytes / packets sent / received per:
- Nodes
- Namespaces
- Workload
- Pods
The flow graphs has been removed from this dashboard.
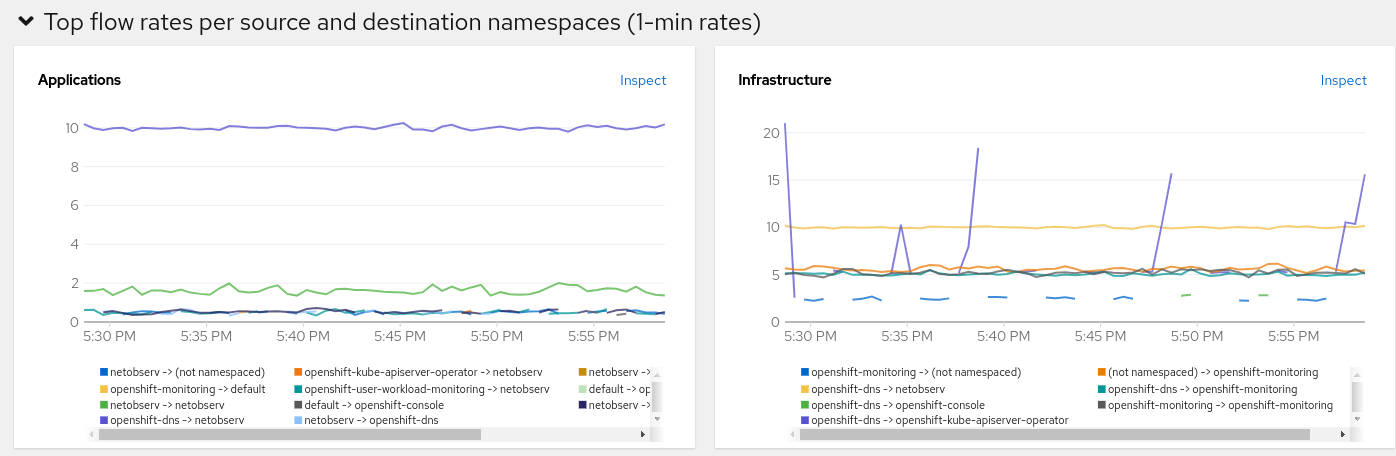
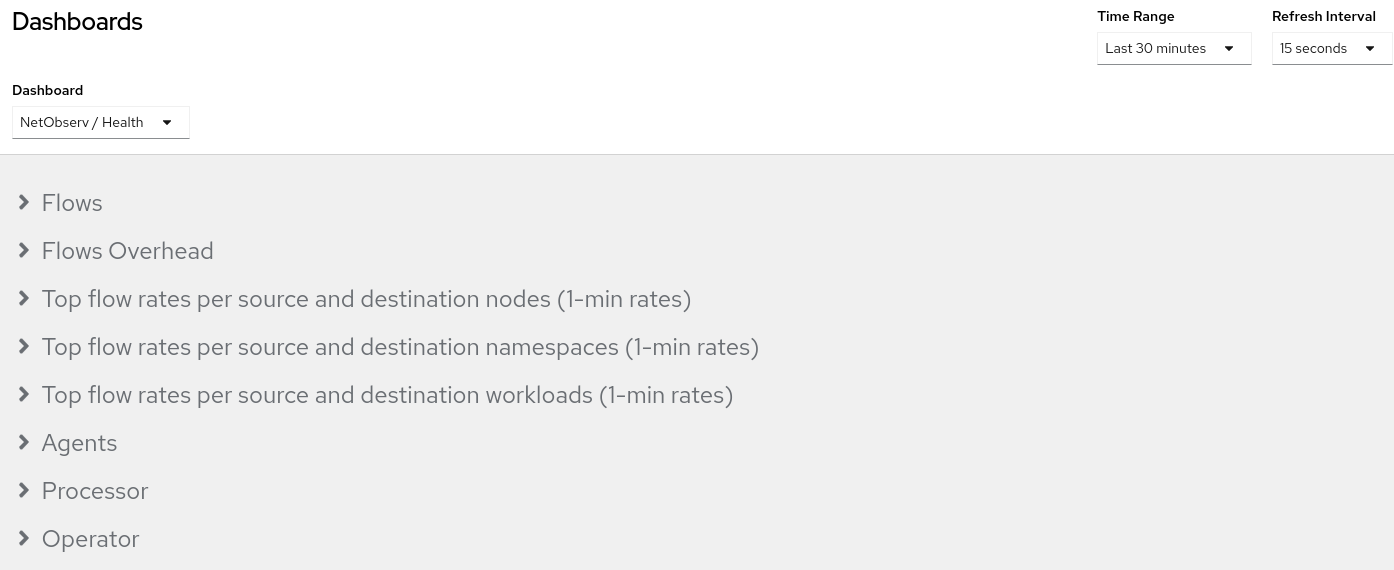
NetObserv / Health dashboard has also been updated:
- flows overhead has been added
- top flow rates per nodes / namespaces / workload / pods

Infrastructure / Application metrics are splitted when possible (Namespaces, Workload, Pods) in both dashboards.

- is blocked by
-
-
- Closed
-
- is depended on by
-
-

- Closed
-
-
OCPSTRAT-964 Metrics and dashboard enhancements for Lokiless usage
-

- Closed
-
- relates to
-
-
- Closed
-
-
-
- Closed
-
-
-
- Closed
-
- links to
-
 RHSA-2023:116729
Network Observability 1.4.0 for OpenShift
RHSA-2023:116729
Network Observability 1.4.0 for OpenShift
1.
|
Docs Tracker |
|
Closed | |
Unassigned |
2.
|
QE Tracker |
|
Closed | |
Unassigned |
3.
|
TE Tracker |
|
Closed | |
Unassigned |