-
Bug
-
Resolution: Done
-
 Major
Major
-
netobserv-1.4, netobserv-1.5-candidate
-
Quality / Stability / Reliability
-
False
-
-
None
-
Important
-
None
-
None
-
NetObserv - Sprint 244
-
None
-
None
-
None
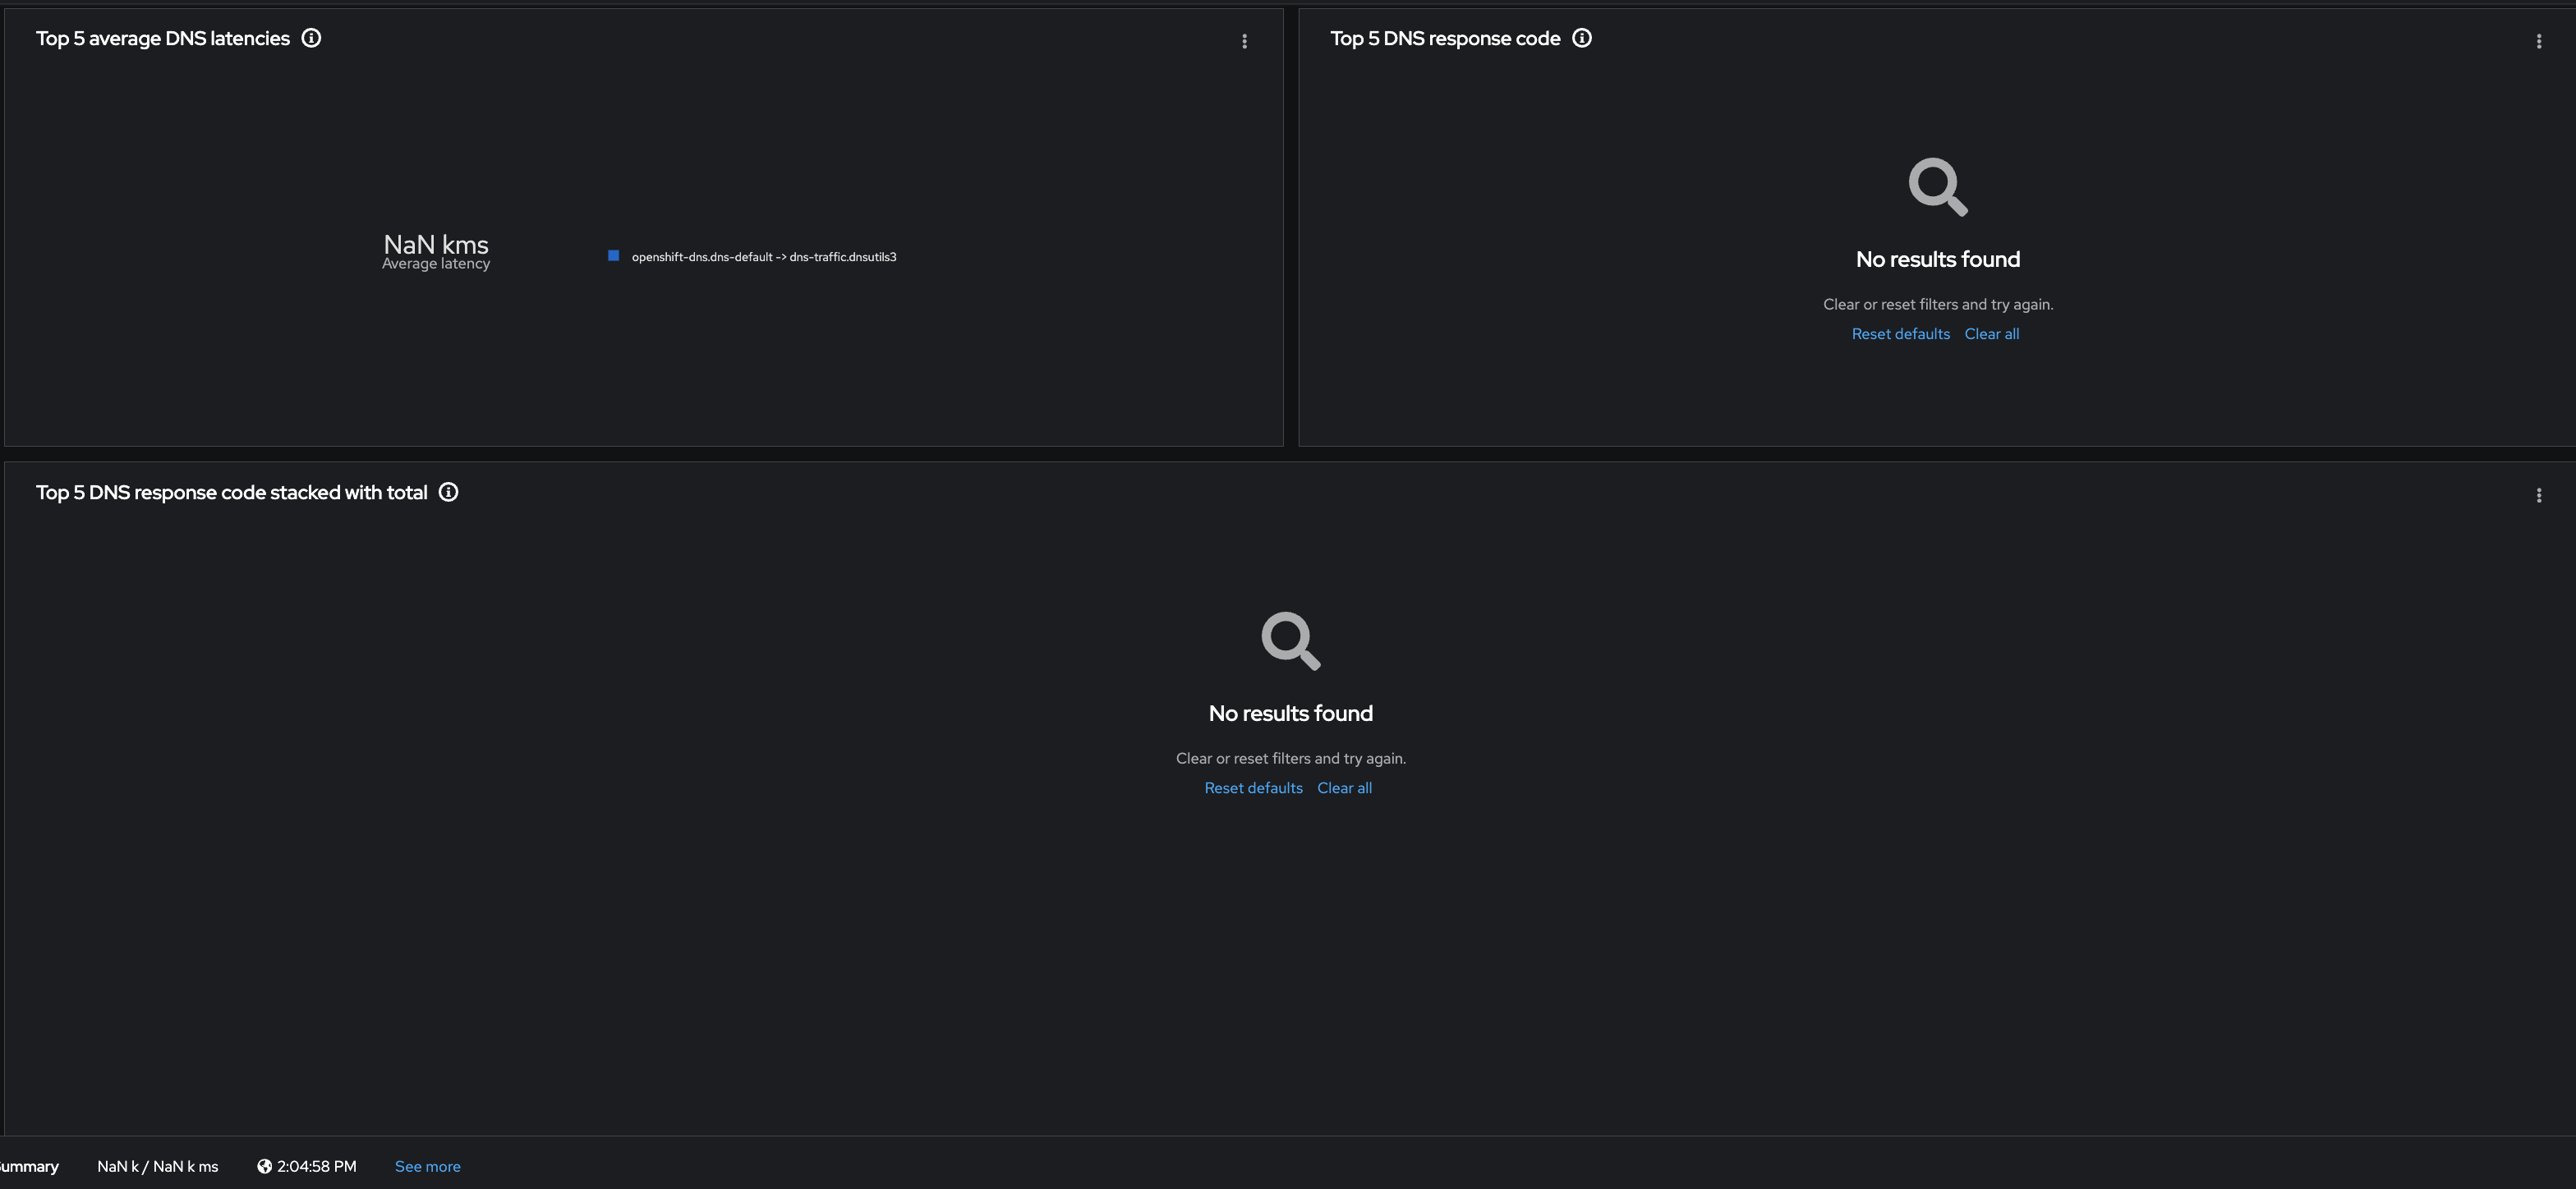
Description of problem:
Empty/NaN graphs are seen on overview tab even though flows are observed on the netflow-table view.

The tooltips in the Query Summary for overview and topology view reference RTT even though RTT is not even enabled
Steps to Reproduce:
1.Follow the same steps referenced in https://issues.redhat.com/browse/NETOBSERV-1379
1. Edit browser cache to use a not yet implemented metric type such as `metricType":"droppedBytes"`
2. Open plugin page
Actual results:
Panels show empty/NaN values
Expected results:
All panels should show non-empty, non-NaN values
PTAL the screenshots below for reference


- relates to
-
-
- Closed
-
- links to
-
 RHSA-2023:121076
Network Observability 1.5.0 for OpenShift
RHSA-2023:121076
Network Observability 1.5.0 for OpenShift
- mentioned on