• Icon: Bug Bug
    • Resolution: Done
    • Icon: Normal Normal
    • netobserv-1.5
    • netobserv-1.4
    • Operator
    • None
    • False
    • None
    • False
    • Hide
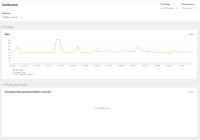
      Previously, using the default metrics settings, the "NetObserv / Health" dashboard was showing an empty graph named "Flows Overhead". You could still get this metric by removing "namespaces-flows" and "namespaces" from the list of ignored tags.
      Now, using the default metrics settings, this metric will be visible.
      Show
      Previously, using the default metrics settings, the "NetObserv / Health" dashboard was showing an empty graph named "Flows Overhead". You could still get this metric by removing "namespaces-flows" and "namespaces" from the list of ignored tags. Now, using the default metrics settings, this metric will be visible.
    • NetObserv - Sprint 243, NetObserv - Sprint 244
    • Moderate

      Description of problem:

      In Observe > Dashboards, NetObserv / Health, there is no graph for "Flows Overhead".  That should not be the case.

      Steps to Reproduce:

      1. Make sure you are getting flows in Observe > Network Traffic.
      2. Go to Observe > Dashboards.  From the dropdown at the top, select "NetObserv / Health".
      3. The "Flows Overhead" graph is missing.  It says "No datapoints found."
      

      Actual results:

      Graph is missing.

      Expected results:

      Expected a graph


      Workaround

      As a workaround, it is possible to retrieve this metric by configuring FlowCollector `spec.processor.metrics.ignoreTags` , removing "namespaces-flows" and "namespaces" from that list of tags.

              jtakvori Joel Takvorian
              stlee@redhat.com Steven Lee
              Nathan Weinberg Nathan Weinberg
              Votes:
              0 Vote for this issue
              Watchers:
              4 Start watching this issue

                Created:
                Updated:
                Resolved: