-
Bug
-
Resolution: Done
-
 Undefined
-
netobserv-1.4-candidate
-
None
-
Quality / Stability / Reliability
-
False
-
-
None
-
None
-
None
-
None
-
NetObserv - Sprint 241
-
None
-
None
-
None
(Initially described in comments for NETOBSERV-1109)
For traffic where src and dst are on the same node, the computed metrics are often wrong.
To reproduce:
- Deploy default netobserv / set sampling = 1
- run "oc get pods -owide" to get the IP of the console plugin pod, and to get the name of the FLP pod that runs on the same node than the console plugin
E.g:
$ oc get pods -owide
NAME                                            READY   STATUS    RESTARTS   AGE    IP             NODE                                         NOMINATED NODE   READINESS GATES
flowlogs-pipeline-48mds                         1/1     Running   0          117m   10.129.0.78    ip-10-0-188-74.eu-west-3.compute.internal    <none>           <none>
flowlogs-pipeline-4zzdf                         1/1     Running   0          117m   10.129.2.17    ip-10-0-180-132.eu-west-3.compute.internal   <none>           <none>
flowlogs-pipeline-82zw4                         1/1     Running   0          117m   10.131.0.24    ip-10-0-145-95.eu-west-3.compute.internal    <none>           <none>
flowlogs-pipeline-f8r89                         1/1     Running   0          117m   10.128.2.33    ip-10-0-193-116.eu-west-3.compute.internal   <none>           <none>
flowlogs-pipeline-qbmjm                         1/1     Running   0          118m   10.128.0.54    ip-10-0-205-251.eu-west-3.compute.internal   <none>           <none>
flowlogs-pipeline-zp99j                         1/1     Running   0          118m   10.130.0.146   ip-10-0-149-244.eu-west-3.compute.internal   <none>           <none>
loki                                            1/1     Running   0          148m   10.131.0.21    ip-10-0-145-95.eu-west-3.compute.internal    <none>           <none>
netobserv-controller-manager-7569476d6b-mfvhc   2/2     Running   0          56s    10.129.2.18    ip-10-0-180-132.eu-west-3.compute.internal   <none>           <none>
netobserv-plugin-79765448f5-gfhq8               1/1     Running   0          27s    10.129.2.19    ip-10-0-180-132.eu-west-3.compute.internal   <none>           <none>
=> take plugin's IP 10.129.2.19 and FLP pod flowlogs-pipeline-4zzdf
- Run a couple of times "oc exec -it flowlogs-pipeline-4zzdf – curl https://10.129.2.19:9001 -k"
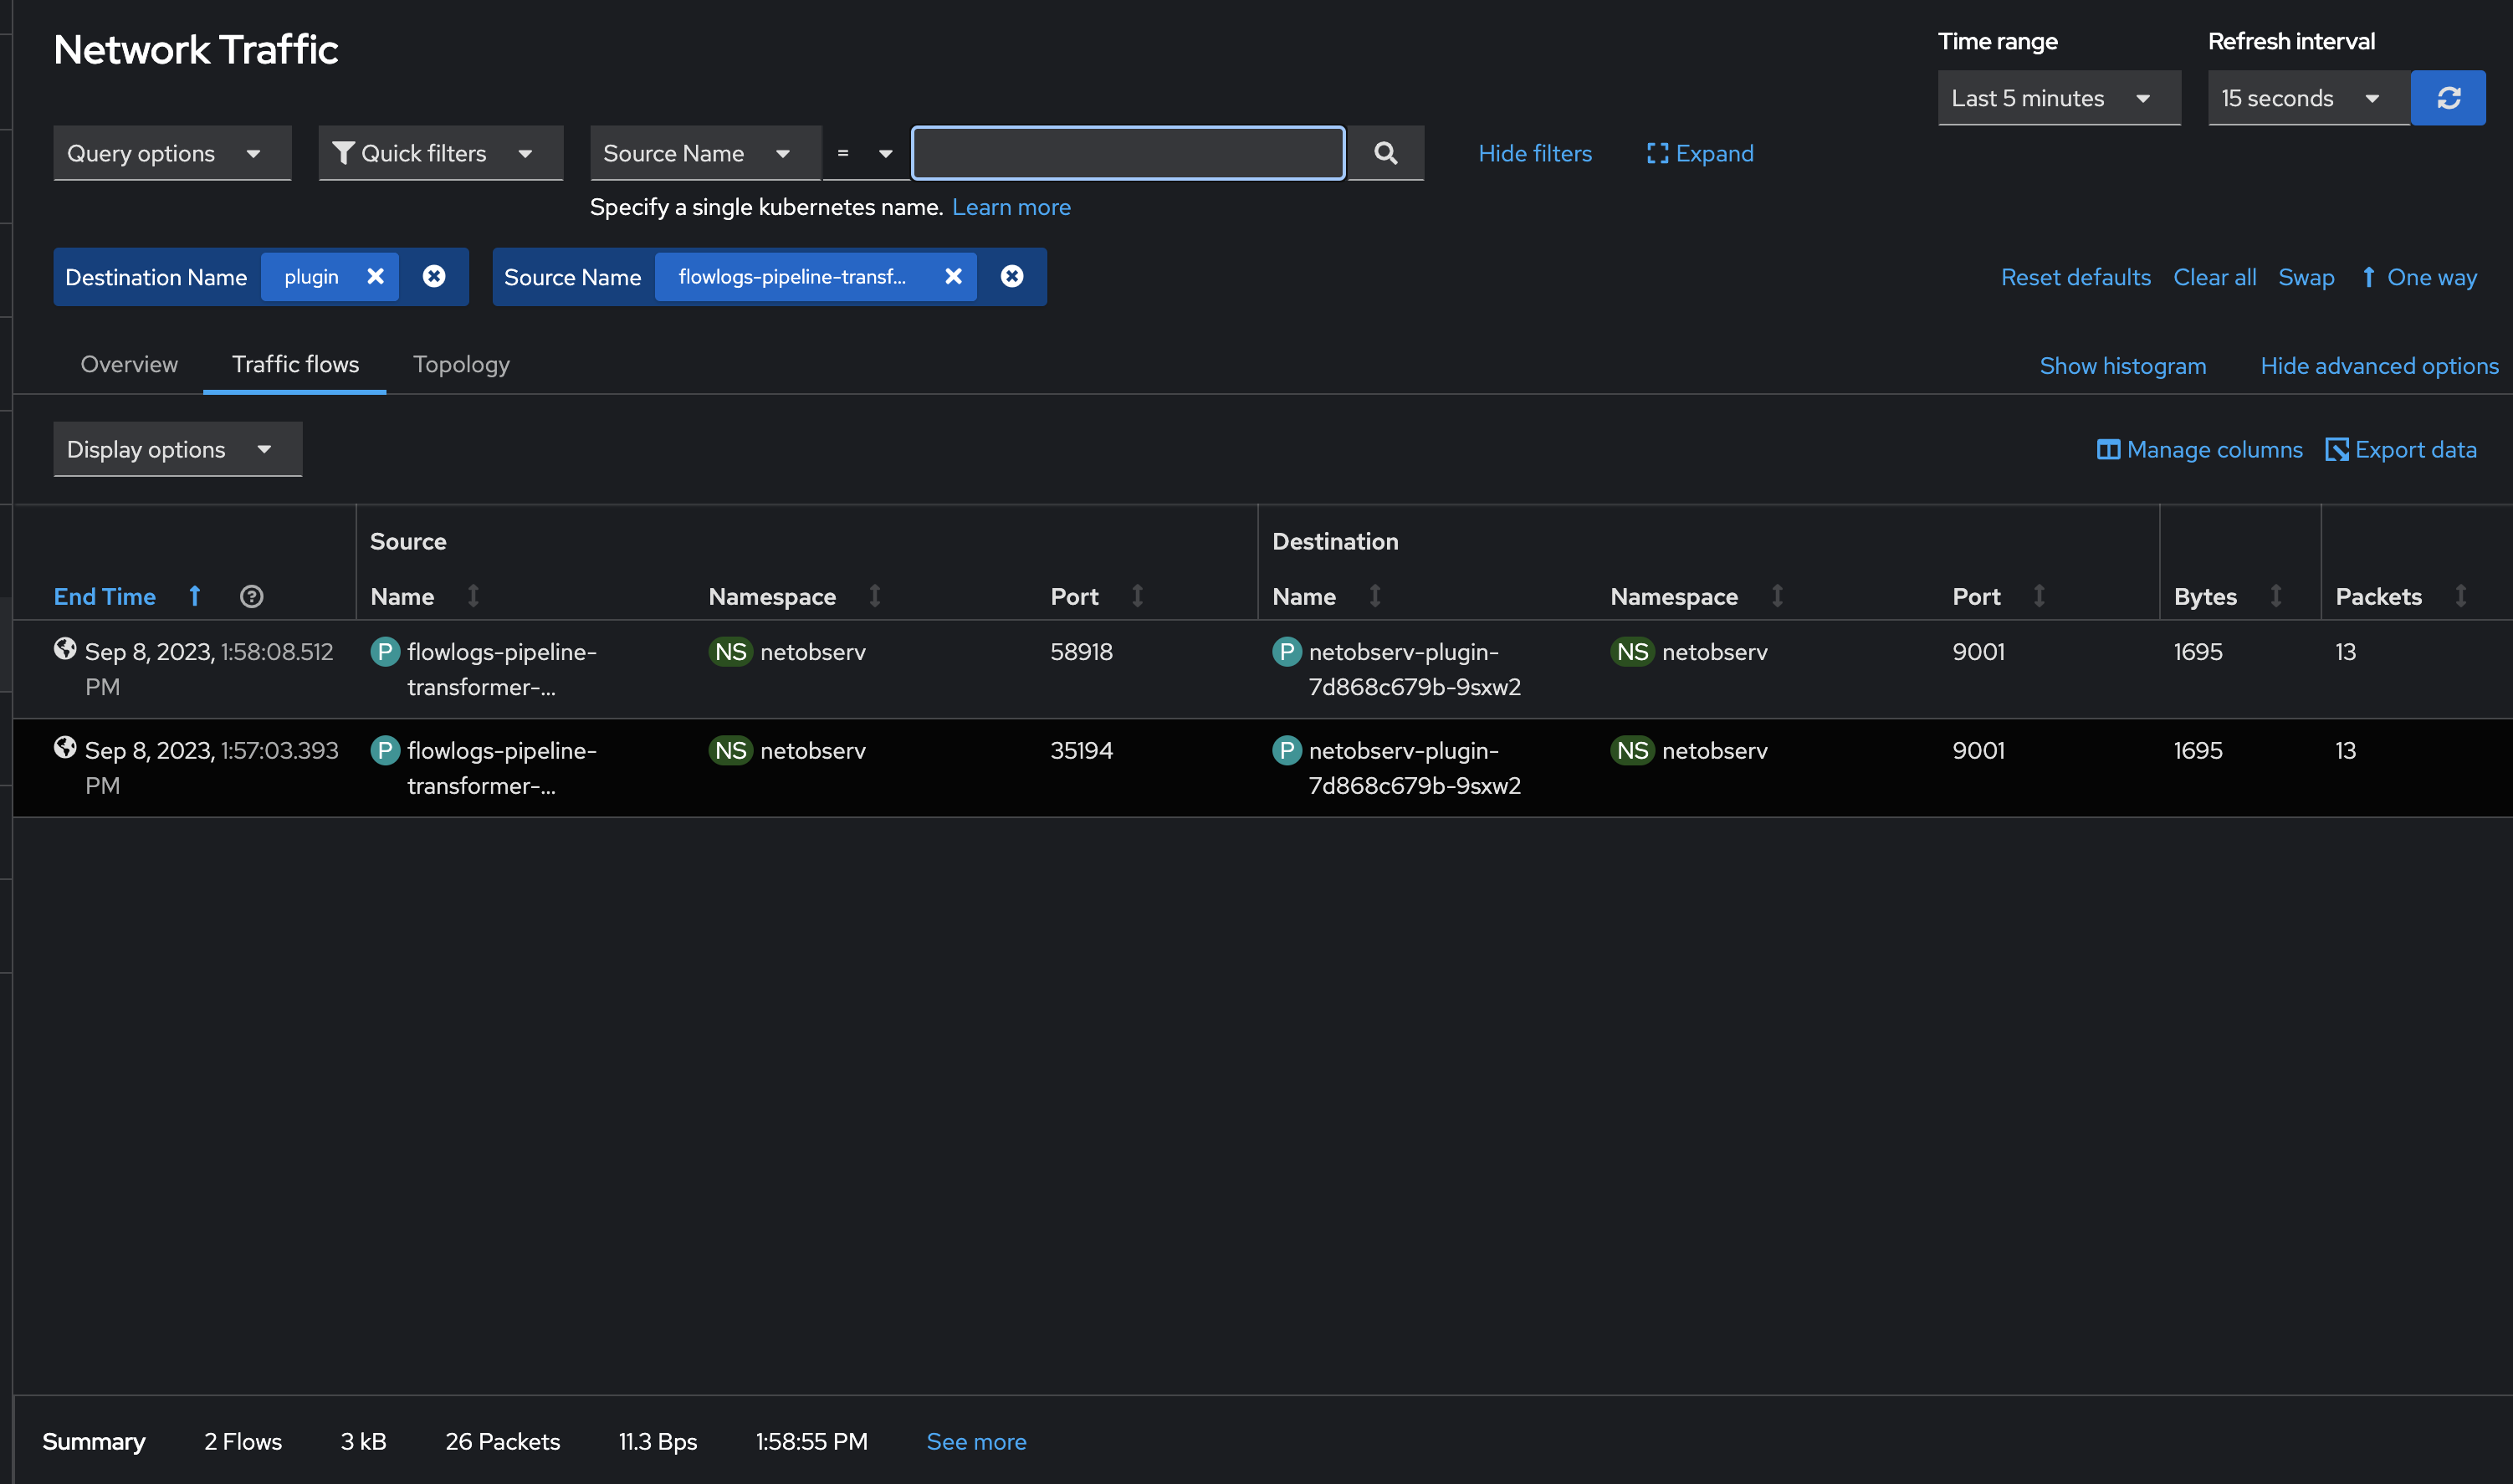
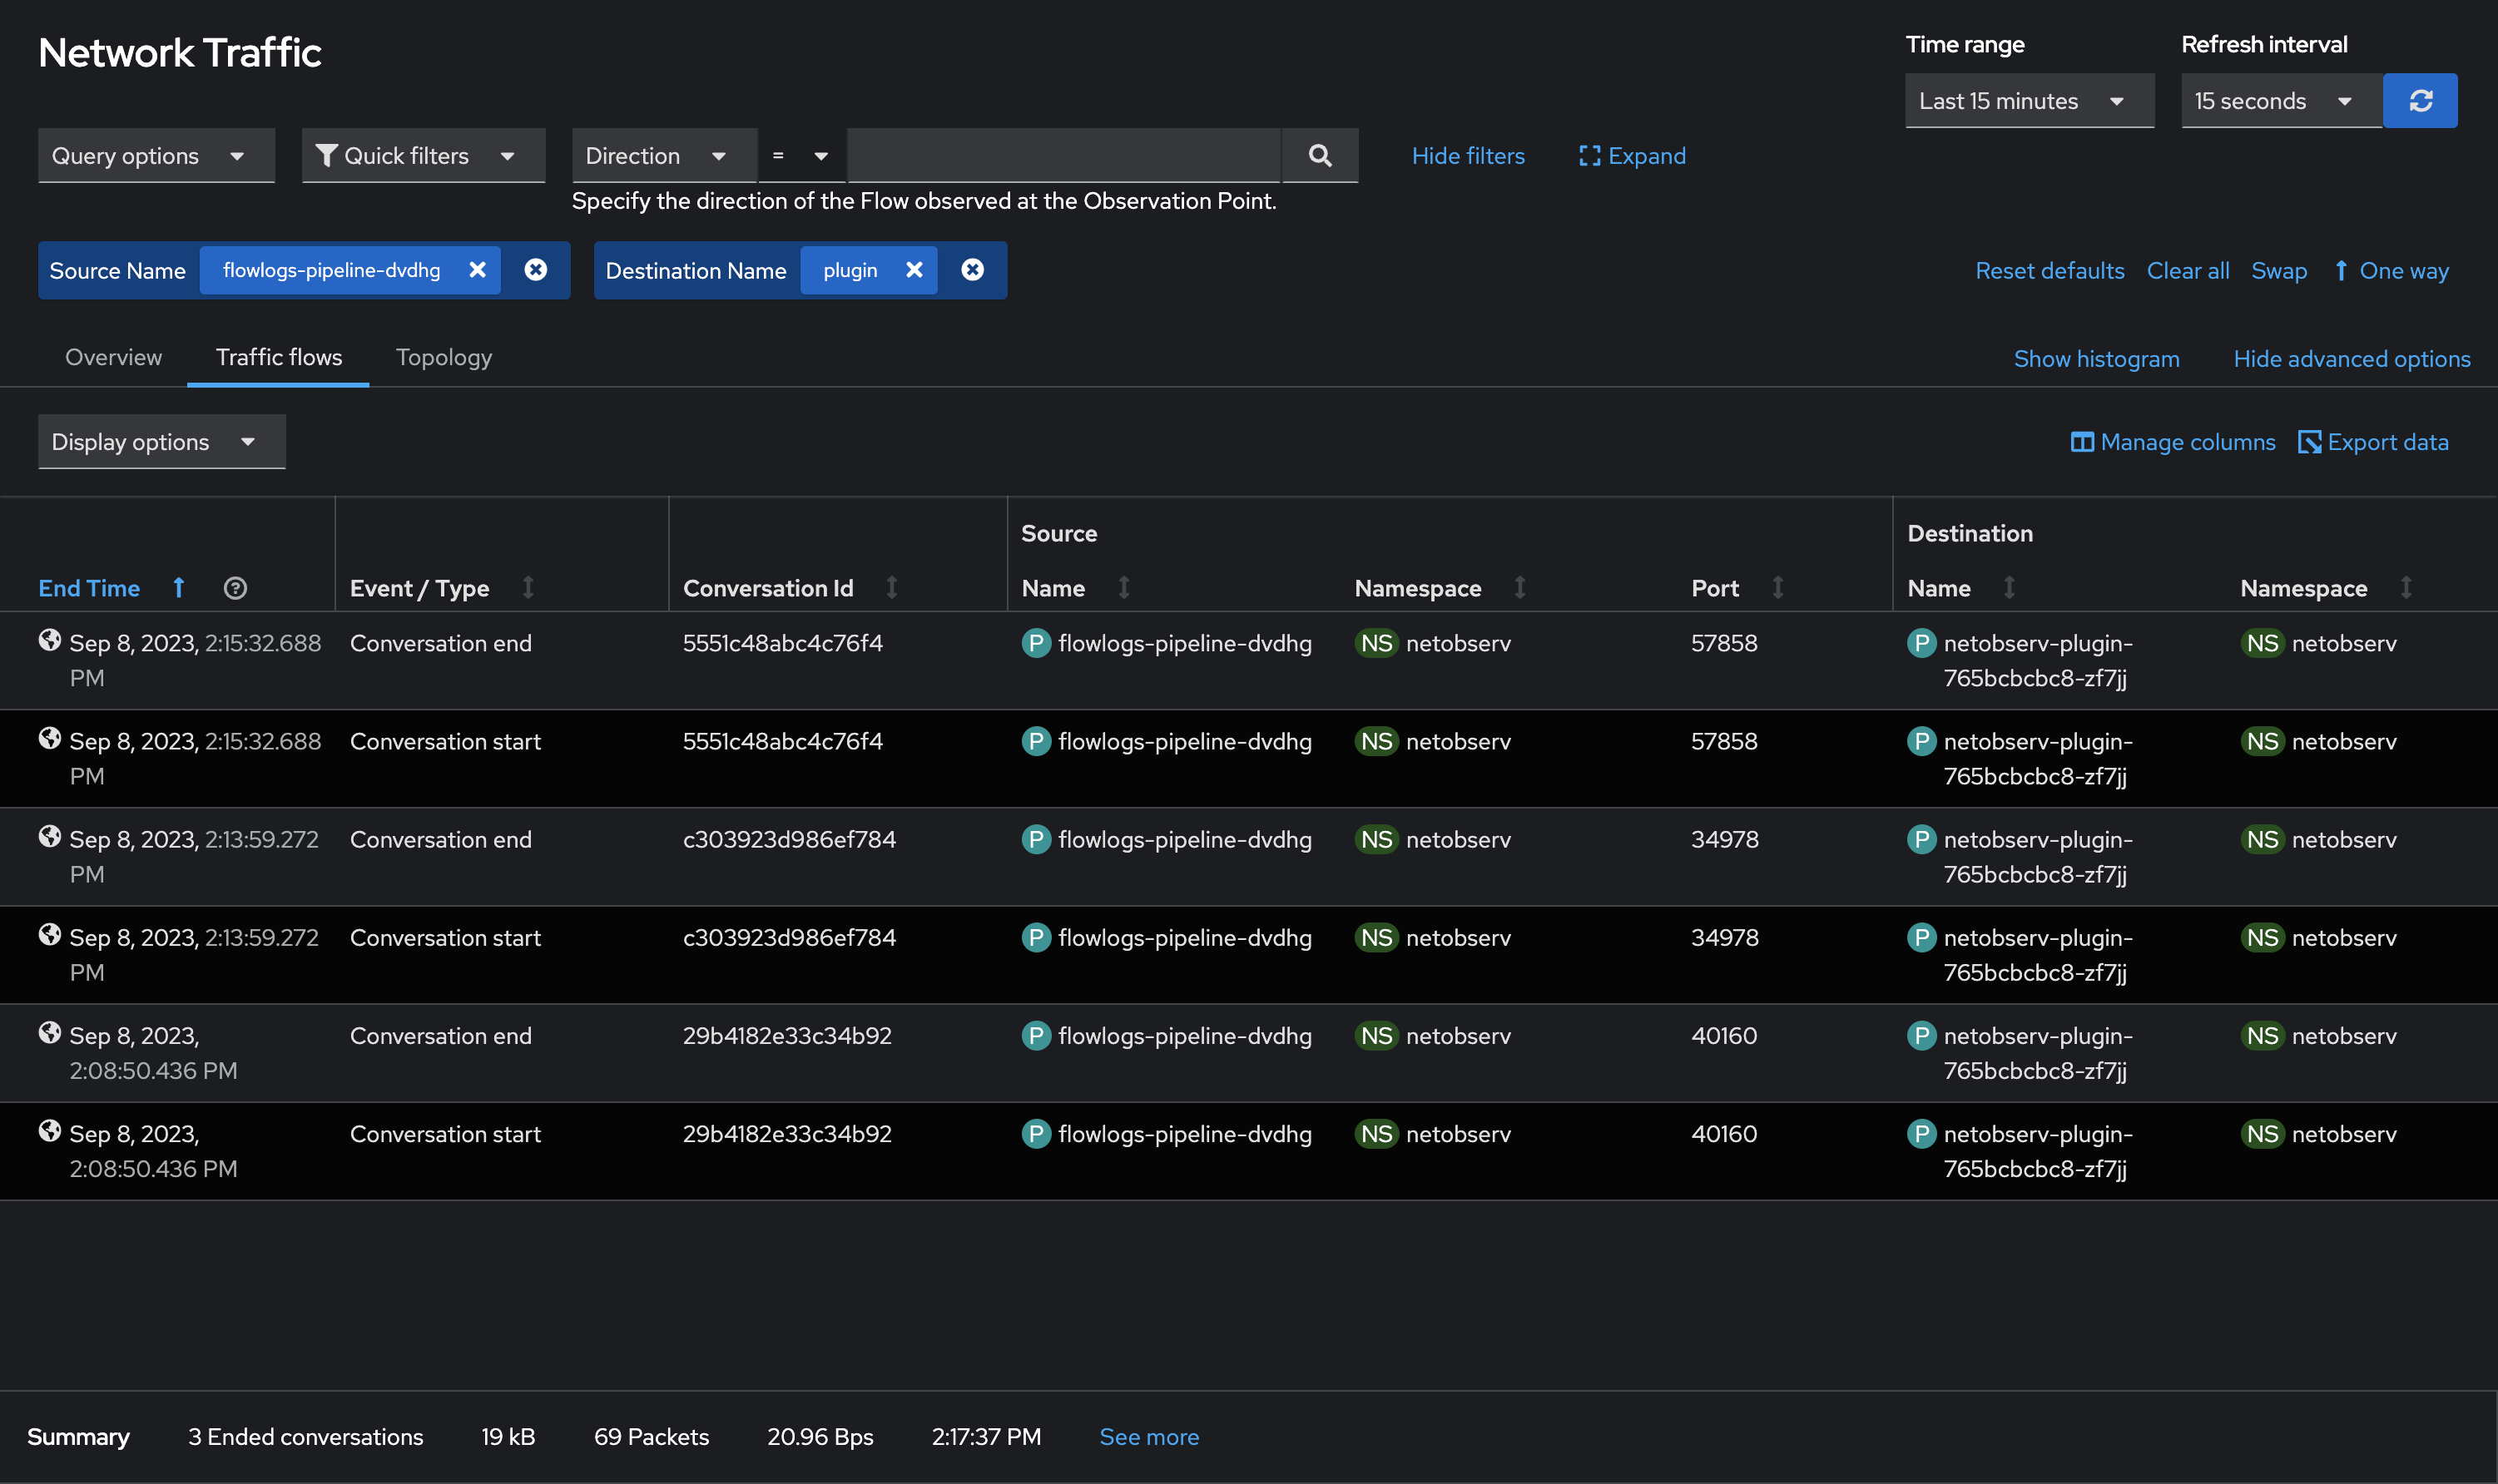
- Open the console plugin in the browser, with filters: Source Name="flowlogs-pipeline-4zzdf", Destination Name=plugin . Keep "Show duplicates" box unchecked and "One way".
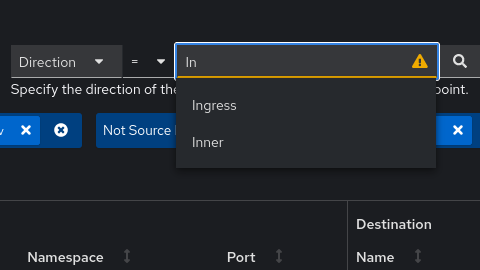
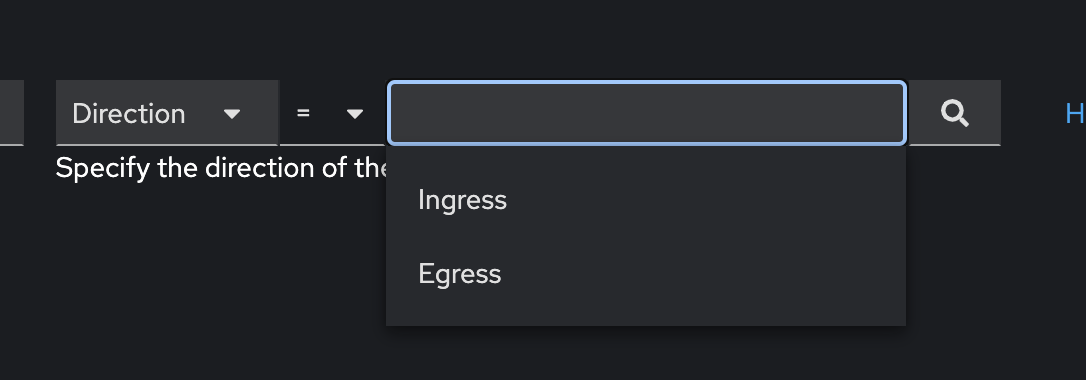
- You should see one flow for every curl you did. When you display the "Direction" column, you should see that some are Ingress and others are Egress, randomly (if you're unlucky and only see Ingresses, run more curls).
- Note the total bytes summary in the bottom bar
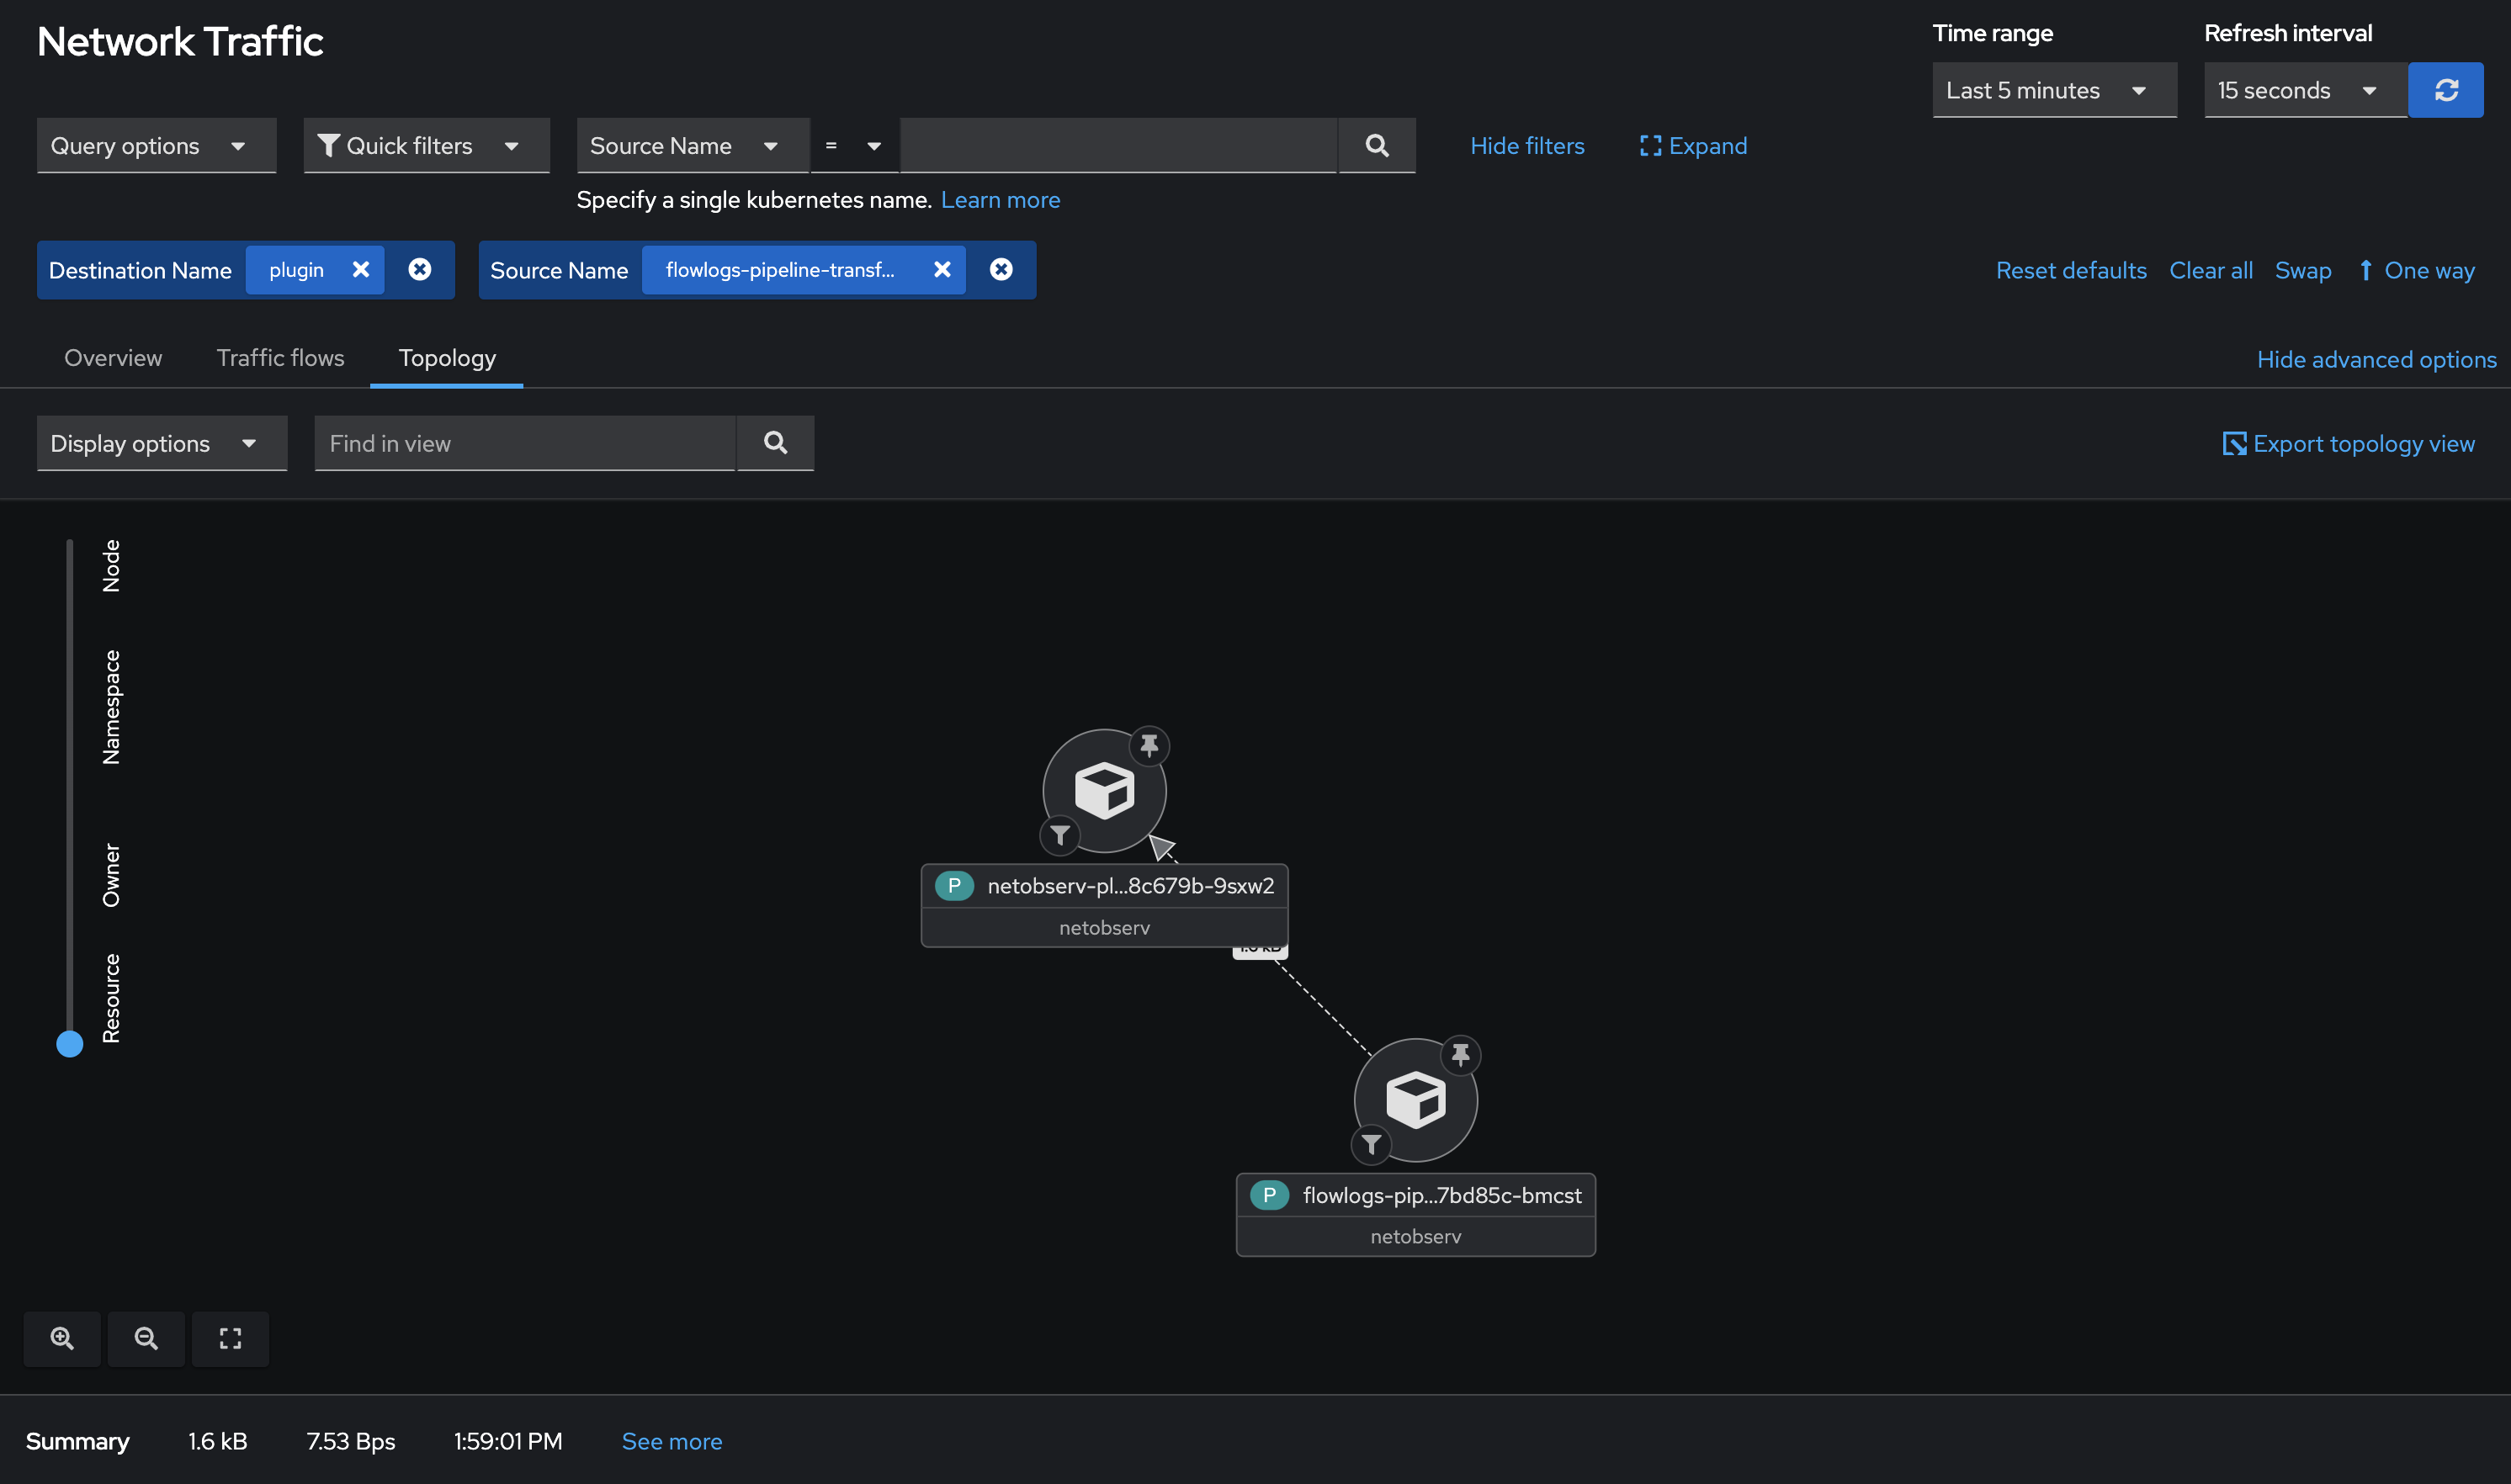
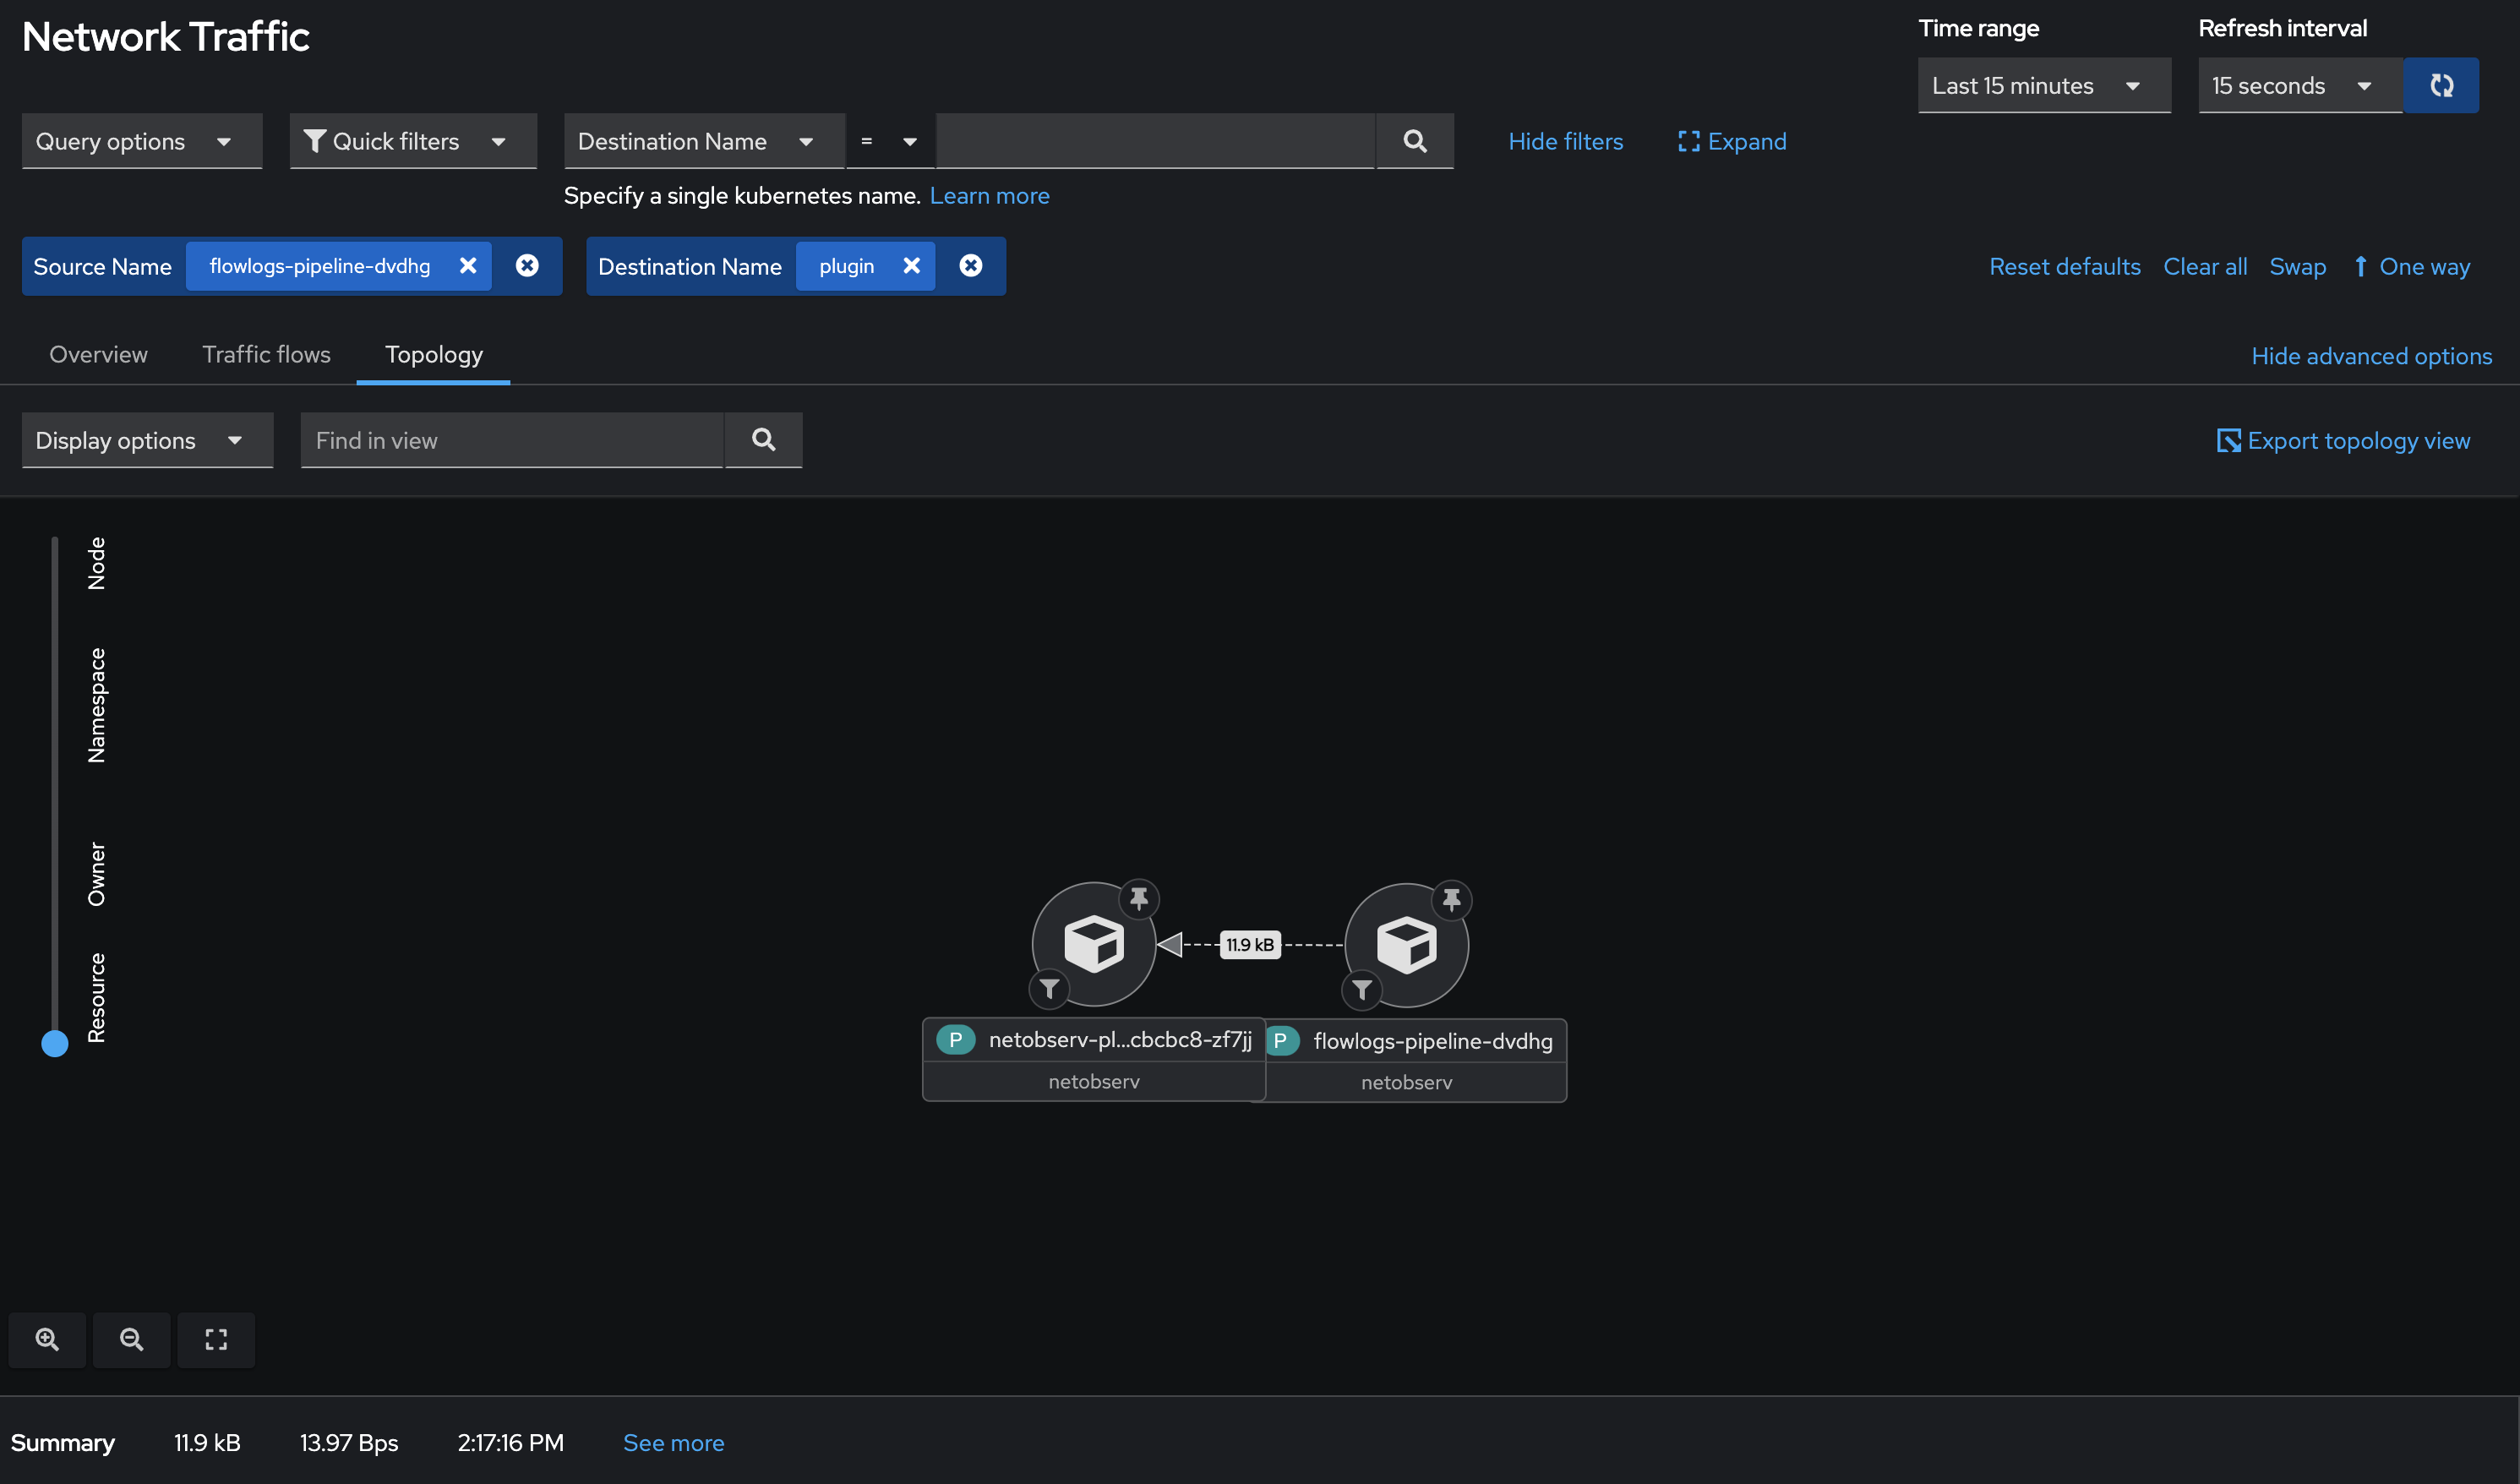
- Switch to the Topology view, set slider to Resource scope
- In advanced / display options, set Edge labels to Total bytes
Expectation: The value on the edge label should more or less match the total bytes summary that you noted on the Flows table (with some small error margin due to rate computation)
Actual result: The edge label value is much lower (like twice lower) than the value shown on Flows table. In fact, it accounts only for the Ingress flows and not the Egress ones displayed in that table.
- links to
- mentioned on
(1 mentioned on)