-
Bug
-
Resolution: Not a Bug
-
Undefined
-
None
-
None
-
None
-
False
-
-
False
-
NEW
-
NEW
-
-
-
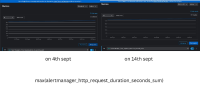
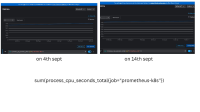
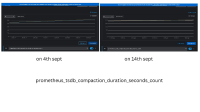
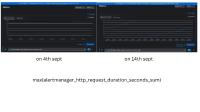
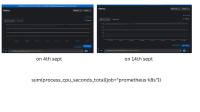
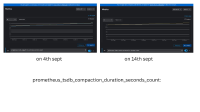
We have noticed an increase in the following metrics over a ten day span with the clusters being idle in both the architectures s390x and x86.
1. Sum of durations of Http requests made to the alert manager
2. Total CPU time (in seconds) consumed by all processes associated with the "prometheus-k8s" job.
3. One metric which is used to measure and track the number of compaction operations performed by the Prometheus TSDB.
